Nobody Can Tell You What Observability Really Costs
Every observability vendor bills in a different unit. We priced one fixed Kubernetes workload with each vendor's own model to show the real cost, why the cheapest option changes as you grow, and why the curve doesn't scale.
 Nati ShalomCo-founder & CTO

TL;DR
- Your observability bill is several numbers multiplied together: services × replicas × signals × cardinality × retention. That is why it compounds instead of growing in a line.
- Vendors bill in incompatible units. The only honest comparison is dollars per month for one fixed workload, at one scrape rate, with AWS telemetry handled the same way for everyone.
- A flat node price is not a flat bill. In our model, a $30-per-node license was 78% of the real cost; the rest is the data plane in your own cloud.
- There is no universal cheapest. The winner flips with data density per node and the discount you can negotiate.
- The curve doesn't scale. A cheaper vendor buys time; an architecture that stops storing data nobody reads changes the outcome.
The Dashboard Series · Part 3 of 3
Ask a platform team what their biggest cloud costs are, and the list keeps looking the same: compute, storage, and then, surprisingly high up, the bill for watching everything else. Observability has quietly grown from a line item into one of the highest costs in the stack, and it is growing faster than the systems it watches.
Here is why. Your observability bill is not one number; it is several multiplied together: how many services you run, how many replicas of each, how many signals each one emits, how many unique label combinations those signals carry (cardinality), and how long you keep it all. Every one of those tends to grow over time, and because they multiply rather than add, the bill compounds. Add a few services and a couple of new labels, and you have not made the bill a little bigger; you have put part of it on a curve.
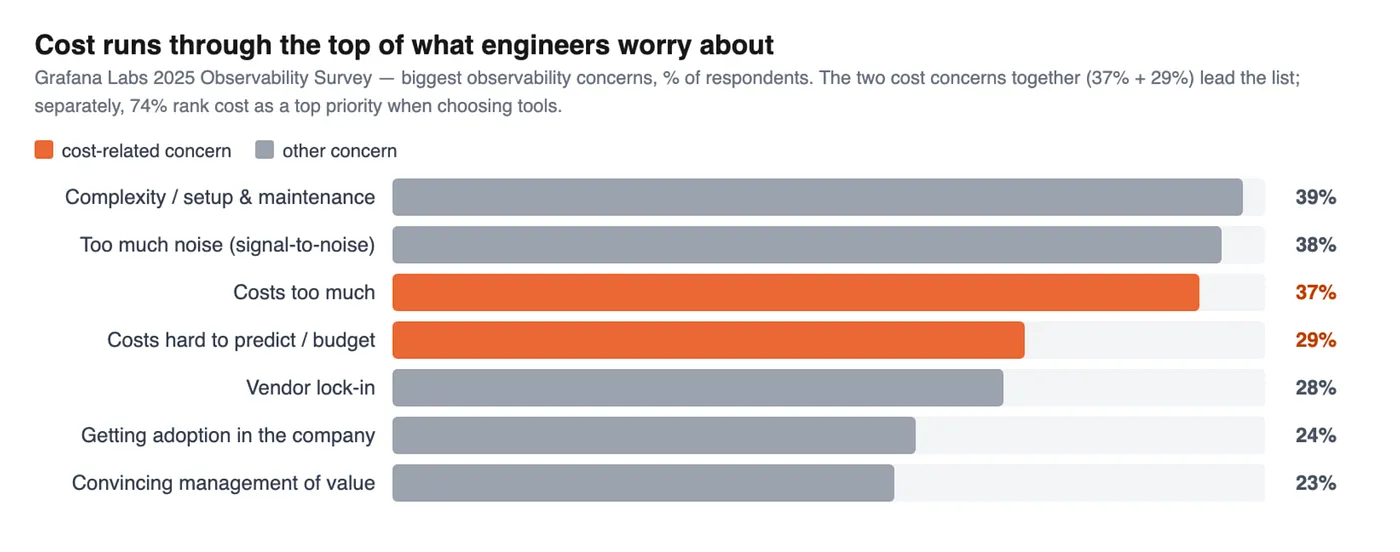
This is why "our monitoring bill is bigger than the thing it monitors" has become its own genre. It turns up again and again in the bill-shock threads that reach the top of r/devops and Hacker News, and in the survey data. In Grafana's 2025 observability survey, the two cost concerns sit right behind complexity and noise at the top of the list: 37% say it costs too much, and another 29% say the bill is too hard to predict. Cost is also a top priority for 74% of teams when they choose a tool, and observability now eats around 17% of the average company's compute-infrastructure spend, more than half of it for some. It is one of the few infrastructure topics that reliably makes engineers angry.
And it is about to get worse, for a specific reason: AI. The whole point of the current wave is more software doing more on its own: more services, more agents, more automated actions. Every one of those is another thing to monitor, another stream of metrics, logs, and traces to store and query. We are adding the things that generate telemetry at exactly the moment telemetry is already the expensive part. AI does not just create more work for observability. It leans on the cost curve and makes it steeper.
So this has to change. But before you can change a cost, you have to be able to measure it honestly, and that turns out to be surprisingly hard. Every vendor reports the number in a different unit, so "cheap" and "expensive" stop meaning anything you can put side by side. Before we can argue about how to fix the observability bill, we have to agree on what it actually is.
Part 2 argued that the observability bill follows your data: whoever stores the data pays for it. This post gets concrete about the numbers behind that claim. Why is it so hard to compare what vendors charge? How did we put them on a level playing field? And why does the "cheapest" vendor change depending on how big you are?
The problem: every vendor charges for a different thing
There is no shared yardstick for observability cost. Each vendor bills for whatever makes its own product look good.
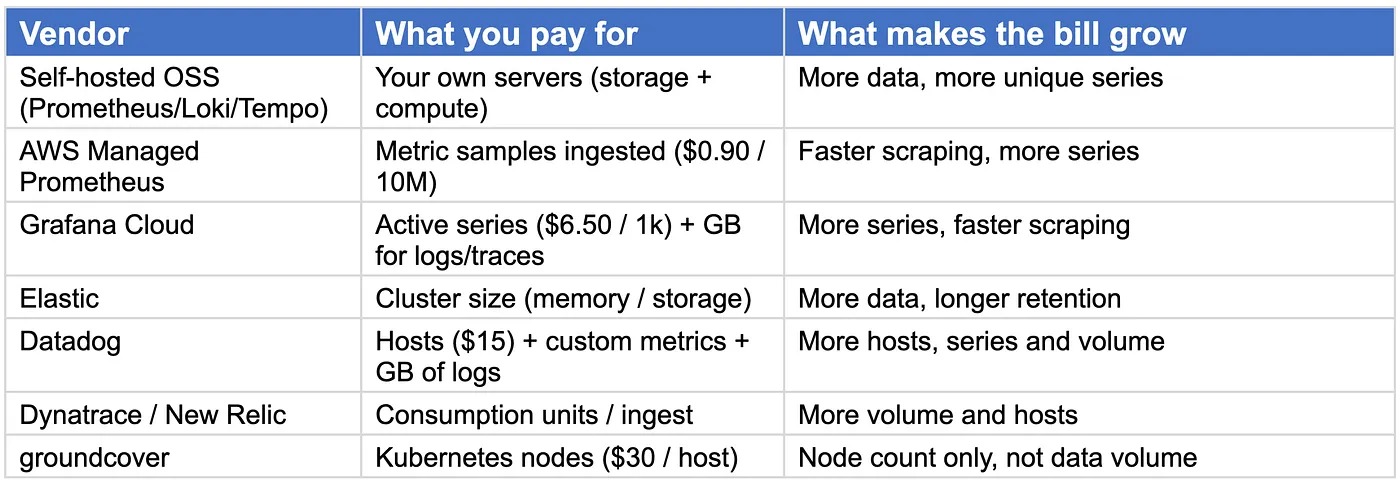
You cannot just put these prices side by side. "$30 per node" and "$6.50 per thousand metrics" and "$0.90 per ten million samples" are not the same kind of number. A vendor can always look cheap by pointing at the unit where its rate is low, and staying quiet about the unit where all your data actually piles up.
So before you can compare anything, you have to turn every one of these into the same thing: dollars per month, for the same workload.
How we leveled the playing field
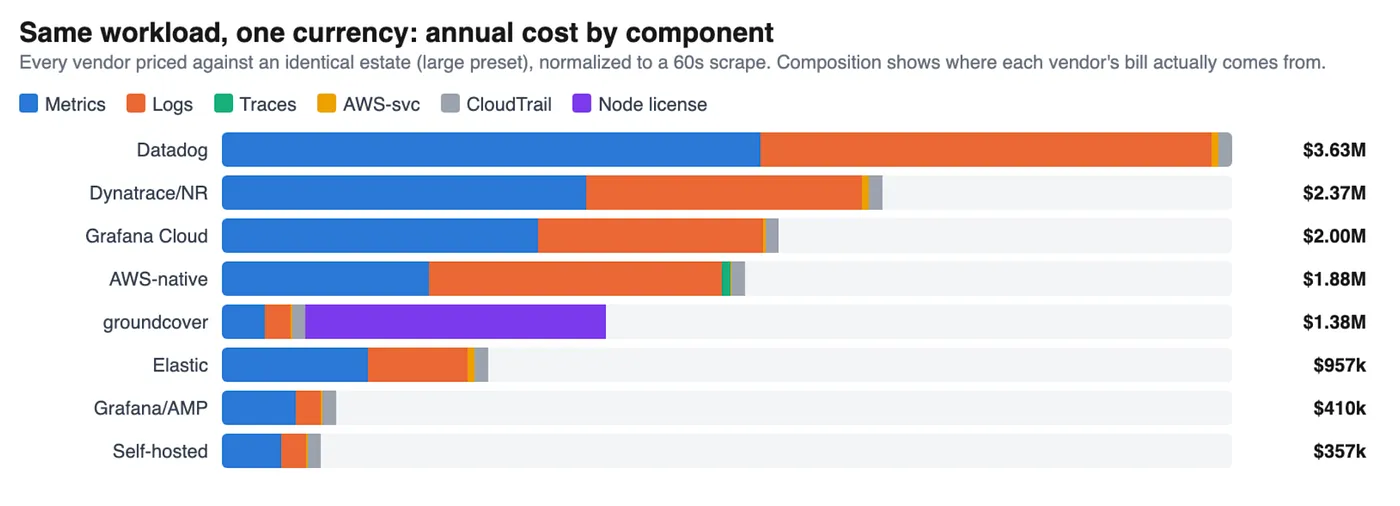
We pick one workload and run every vendor's own pricing against it.
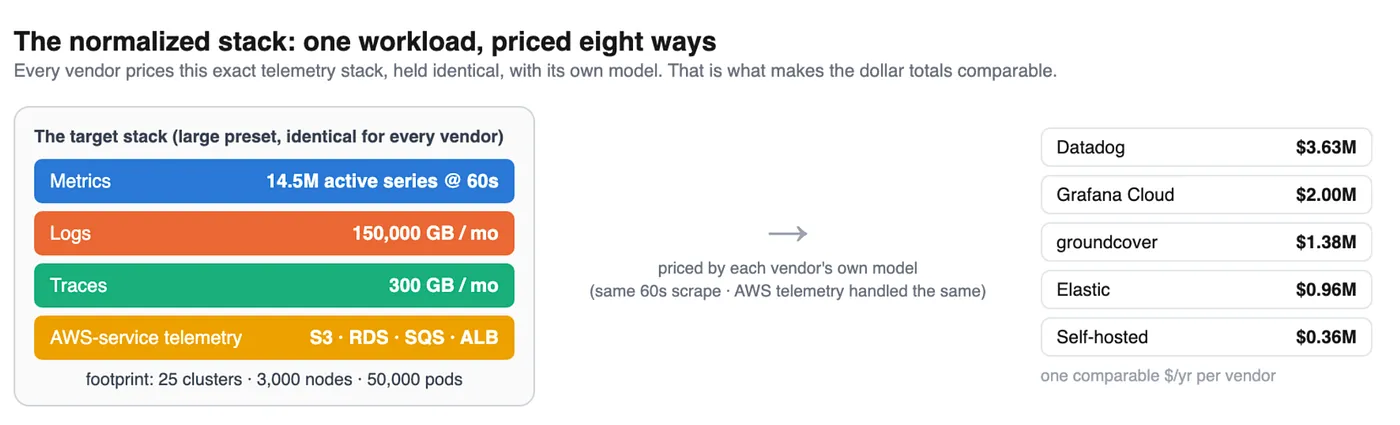
Same everything: the same number of metrics, the same gigabytes of logs, the same traces, the same number of nodes and pods. Those sizes are a preset we built to represent a large Kubernetes estate, not numbers from any vendor's price list. For context on how widely teams run Kubernetes in production, see the CNCF 2023 survey. Here is the exact target stack we priced, held identical for every vendor:
| Target stack (large preset) | Value |
|---|---|
| Clusters | 25 |
| Nodes | 3,000 |
| Pods | 50,000 |
| Active metric series | 14.5M |
| Logs | 150,000 GB / month |
| Traces | 300 GB / month |
| Scrape interval | 60 seconds (normalized) |
| AWS-managed services in scope | S3, RDS, SQS, ALB |
Two fixes do most of the work.
Fix #1: use the same scrape rate. Some tools (AMP, Grafana Cloud, self-hosted Prometheus) collect metrics every 15 seconds by default. That is four times as much data as collecting every 60 seconds, so they look four times pricier for no real reason. We price everyone at 60 seconds so it is fair, and we also show each vendor at its own default so you can see the difference.
Fix #2: handle AWS data the same way for everyone. AWS sends data about RDS, SQS, ALB, and the rest to CloudWatch whether you want it or not. Some tools read it right there, which is cheap. Others copy it into their own cloud, so you pay for the same data twice. We charge each vendor for what it really does, on both sides.
The result is one honest number per vendor: dollars per month, same workload, same rules. That is the only number worth comparing.
groundcover: the sticker price is not the bill
groundcover is the clearest example of why a headline price can fool you.
It charges $30 per node per month, and it genuinely does not care how much data you generate. That part is great, and it is true.
But groundcover keeps your data in your own cloud. You store and run it yourself, on VictoriaMetrics, ClickHouse, and object storage. That is not in the $30. It is a second bill, on your own AWS account, and it grows with your data and how long you keep it, just like everyone else's.
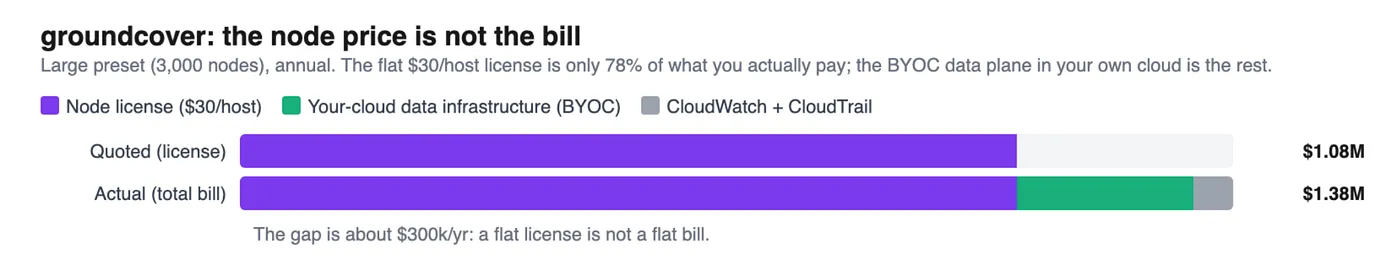
So the sticker price and the real bill are two different numbers. At our large size of 3,000 nodes:
| Layer | Per year |
|---|---|
| Node license (3,000 nodes × $30 / mo) | $1,080,000 |
| Your own cloud storage + compute (BYOC) | $245,988 |
| CloudWatch kept + read in place + CloudTrail | $54,660 |
| Total | $1,380,648 |
The license is 78% of the bill, but it is not the whole bill. Quote just the node price and you have hidden about $300,000 a year. A flat price is not a flat bill.
This is Part 2's point again, from the billing side. Moving your data into your own cloud does not make the cost disappear. It just moves it onto your own infrastructure bill.
There is no single cheapest, and it changes as you grow
The biggest lesson: there is no universal winner. It depends on the shape of your setup, and it shifts as you scale.
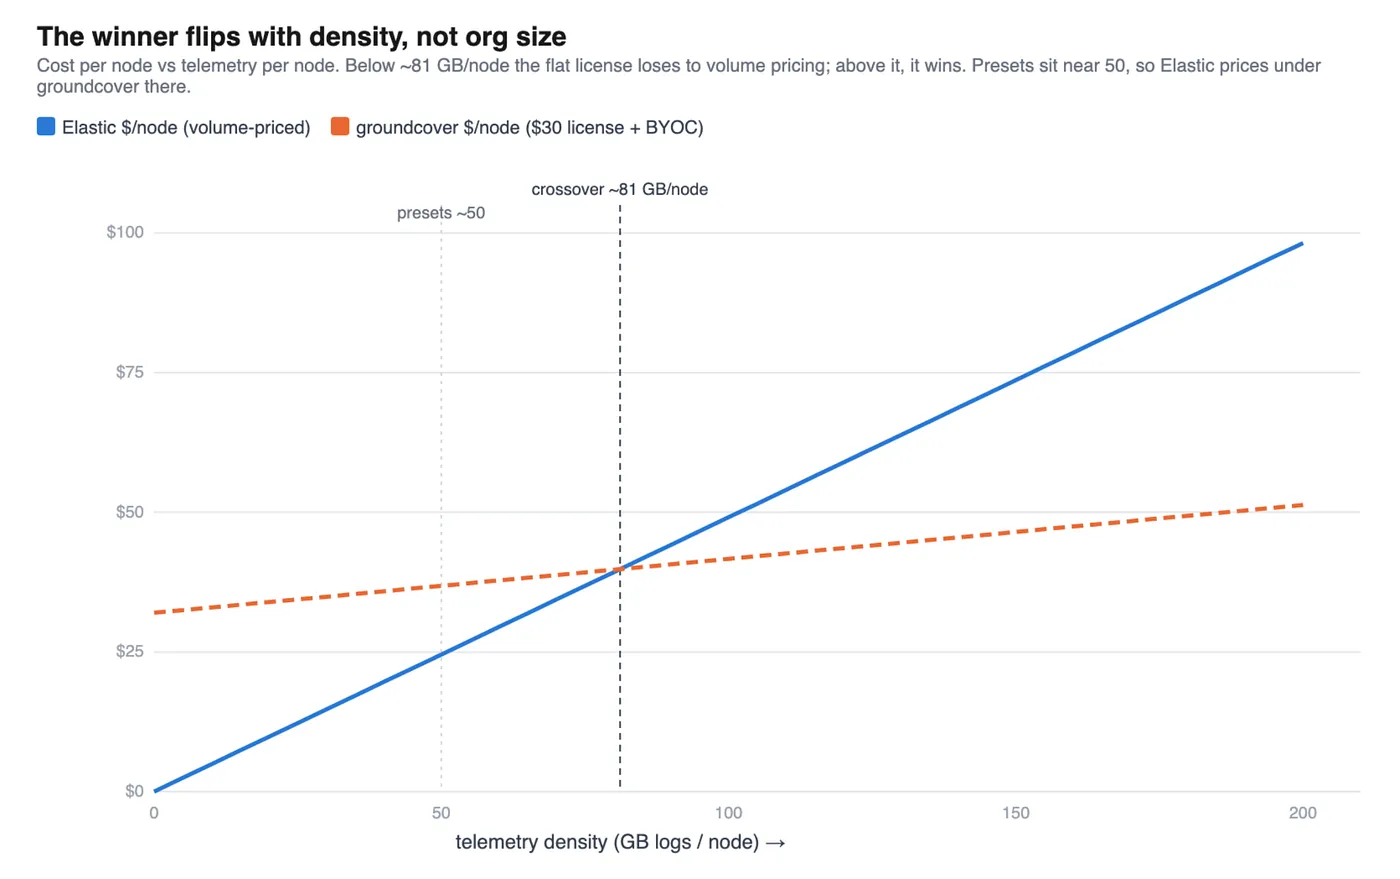
Node pricing (groundcover) and volume pricing (Elastic, Grafana Cloud) trade places depending on how much data each node produces:
- If each node produces a little data, the flat node fee dominates, and the volume-priced vendors are cheaper.
- If each node produces a lot of data, the volume bill overtakes the flat fee, and node pricing wins.
In our model, the tipping point is around 81 GB of logs per node. Our presets sit near 50, below that line, which is why Elastic comes in cheaper than groundcover at every size. Adding more nodes does not change it, because that grows both bills equally. Only density, how much data per node, moves the line.
Two more things bend the numbers as you get bigger, and both are about discounts:
- Node-priced tools give big volume discounts at high node counts. Nobody actually pays $30 × 3,000 at list price. So list prices make node-based vendors look more expensive than a real deal would, right where they have the most room to negotiate.
- Resource-priced tools like Elastic are the hardest to model from outside, and a simple per-metric rate probably undercounts them at high volume. So list prices probably make volume-based vendors look cheaper than they really are.
Both point the same way: at scale, list-price comparisons flatter the volume-priced vendors. The honest takeaway is not "Elastic wins." It is that the gap shrinks with the discount you can negotiate, and the winner depends on your density.
What to remember
- You cannot compare vendors on their own units. Turn everything into dollars per month for one fixed workload.
- Level two things first: the scrape rate, and how AWS data is handled.
- A flat sticker price, per node or per host, is not a flat bill. Ask where the data lives and who pays to store it.
- There is no universal cheapest. It depends on your data per node and the discount you can negotiate, and it moves as you grow.
The point is not to crown a winner. It is to show the real shape of the cost, so you can choose on fit and architecture instead of on whichever number a vendor decided to print on its pricing page.
A final note: this does not scale
Put the two halves of this post together. Cost is already the loudest complaint in the room, and it is a curve, not a line. It compounds with every service, every label, every extra day of retention. And the thing everyone is racing to build next, more autonomous software, is also the thing that adds the most new telemetry to watch.
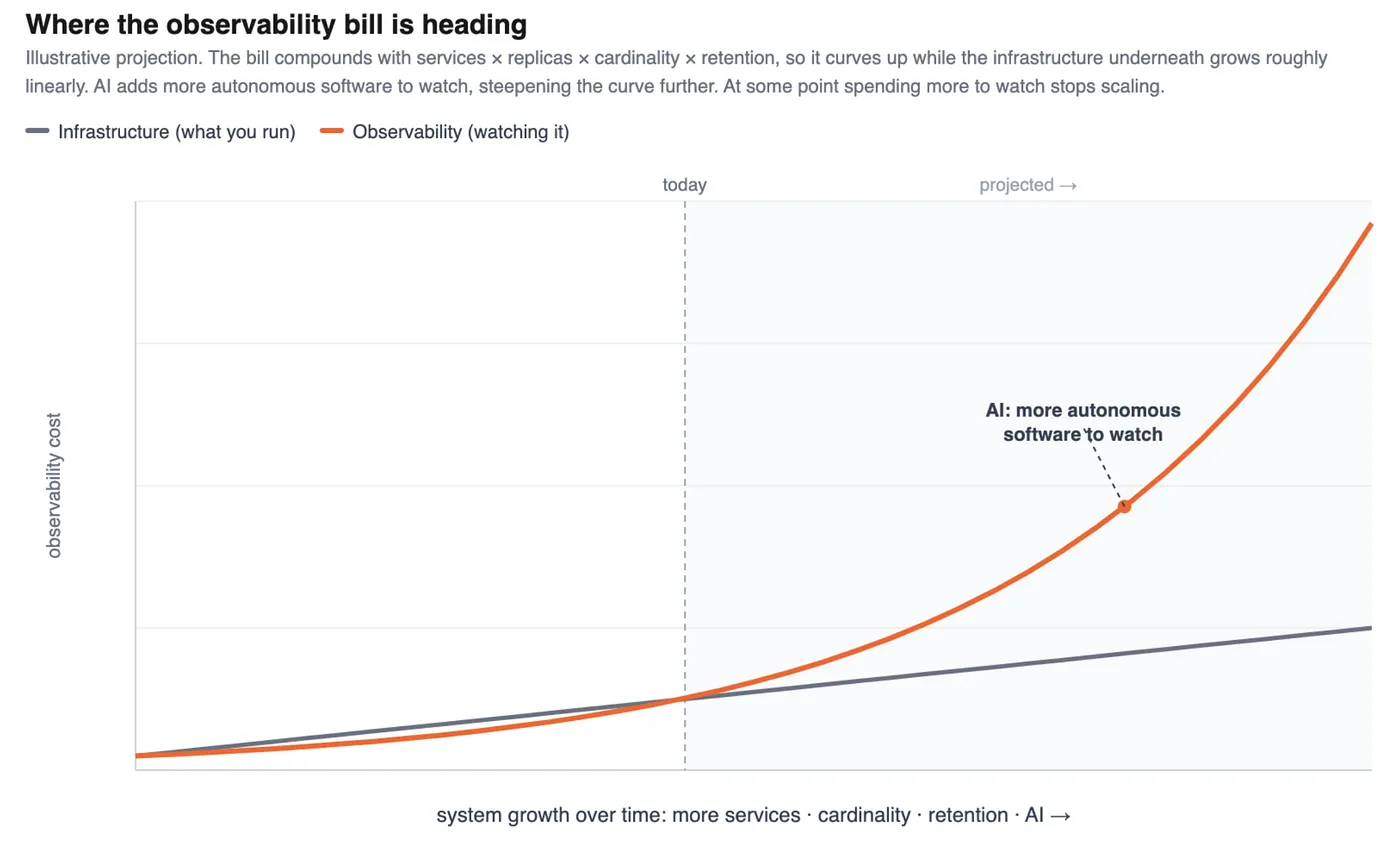
At some point "spend more to watch" stops being a budget line and becomes a building tax. When observability is already around 17% of infrastructure spend and climbing, and AI is about to multiply the number of things emitting signals, the honest conclusion is that the current approach does not scale. You cannot buy your way out of a curve, and you cannot optimize your way out of it either. A cheaper vendor buys you a little time, not a different outcome.
So the real question is not "which vendor is cheapest." It is "why are we storing all of this in the first place." The whole model assumes a human on the other end of the dashboard: collect everything, keep everything, retain everything, because a person might one day need to scroll back and look. That assumption is what makes the giant, always-on data lake mandatory, and that lake is what the bill is for.
Autonomous systems break the assumption. An agent that investigates and acts does not need years of dashboards or every log kept warm for a human to browse. It needs the right signal at the right moment, and it can go and get it. Move the action to where the data already lives, instead of copying all the data to where a human sits, and most of the lake stops being necessary. The cost does not drop because you negotiated harder. It drops because you stopped hoarding data nobody reads.
This is why the AI wave is not only the thing making observability more expensive. It is also the opening to rethink observability from scratch. If software is going to run itself, it does not need the enormous, human-facing telemetry warehouse we built for the last decade. That is not a smaller bill. It is a different architecture. And the curve in this post is the clearest argument yet for building it.
Which is where this leaves us. Before you can rethink the approach, you have to see the true cost of the current one. That is what this post was for. The next question, the more interesting one, is what you build instead.
FAQ
Why is observability so expensive?
The bill is several growth factors multiplied together: services, replicas, signals per service, cardinality and retention. Each tends to grow, and because they multiply, the cost compounds. In Grafana Labs' 2025 Observability Survey, observability spend averaged 17% of compute infrastructure spend.
How do you compare observability vendors' pricing fairly?
Convert every pricing model into dollars per month for one fixed workload. Normalize the scrape interval (we use 60 seconds for everyone) and charge every vendor the same way for AWS-service telemetry, whether it reads CloudWatch in place or copies the data into its own cloud.
Is node-based observability pricing cheaper than volume-based pricing?
It depends on data density. In our model, a flat node fee wins above roughly 81 GB of logs per node and loses below it. Negotiated discounts at high node counts shift the line further, so the cheapest option changes as you grow.
Is a flat per-node price a flat bill?
No. If the vendor keeps your data in your own cloud, storing and serving that data is a second bill on your own infrastructure. In our 3,000-node model, the node license was 78% of the total; the rest was the data plane.
How this was calculated
Every number here comes from one open cost model, run at the large preset. The inputs are fixed and identical for every vendor:
- Footprint: 25 clusters, 3,000 nodes, 50,000 pods.
- Active metric series: 14.5M, from nodes × 1,500 + pods × 200 + application metrics.
- Logs: 150,000 GB per month. Traces: 300 GB per month.
- Scrape interval: 60 seconds (one data point per minute) for every vendor.
- AWS-managed services in scope: S3, RDS, SQS and ALB, with their CloudWatch telemetry priced the same way for everyone.
Each vendor is then priced with its own pricing model against that identical stack:
- Active-series vendors: active series ÷ 1,000 × a per-1k rate (Grafana Cloud $6.50, Elastic $3.00). Datadog, Dynatrace and New Relic don't bill per active series (Datadog bills per host plus custom metrics, Dynatrace per metric data point, New Relic per GB ingested plus users), so the model converts each to an effective per-1k-series rate: $8.00 for Datadog and $7.50 for Dynatrace / New Relic. Treat those results as estimates.
- AWS Managed Prometheus: samples ingested at $0.90 per 10M (active series × scrape rate across the month).
- Logs and traces: gigabytes × the vendor's per-GB rate.
- groundcover: nodes × $30 for the license, plus the BYOC data plane priced as your own cloud storage and compute (VictoriaMetrics for metrics, discounted for its better compression, plus object storage for logs and traces).
- AWS-service telemetry: a small query cost for tools that read CloudWatch in place, or Metric Streams plus log forwarding for tools that copy it in (billed on both sides).
The same workload is priced twice: once at each vendor's default scrape (List) and once at a common 60-second scrape (Normalized). Every figure in this post is Normalized. The two engines that produce these numbers, a command-line estimator and the in-report calculator, are checked against each other on every change so they never drift.
- #Observability Cost
- #Kubernetes
- #AWS
- #Pricing
- #Autonomous SRE
See remediation-first in your own stack
Install an agent and watch DataAgent map your topology. No credentials, no commitment.
Keep reading
 Engineering13 min
Jev Named the Layer. Now Somebody Has to Measure It.
A model that only makes decisions is the right idea for autonomous operations. But the number that autonomous action depends on is still unmeasured, by the vendor, by the press, and by the first paper built on it.
Nati Shalom • Nov 1, 2026 Engineering13 min
Who Is the Dashboard For?
A self-driving car has no dashboard and more sensors than ever. The same inversion is coming for cloud observability: less data, a sharper picture, and a new answer to multi-cloud.
Nati Shalom • Nov 1, 2026 Engineering7 min
AGNTCon + MCPCon 2026 Recap: Lots of Noise, Little News. And That’s Good News
My takeaways from AGNTCon + MCPCon 2026: agent security dominated, gateways and sandboxes are multiplying, MCP beat A2A on stage, and the real question is no longer whether agents will fix incidents on their own, but how.
Nati Shalom • Oct 26, 2026