Autonomy Is a Body Problem, Not a Data Problem
In 2026 the biggest observability vendors conceded that fixing, not watching, is the point. But an agent bolted onto a billed-by-ingestion data lake inherits the lake's ceiling. Autonomy is a harness problem: tools, state, guardrails, and verification. Not a data problem.
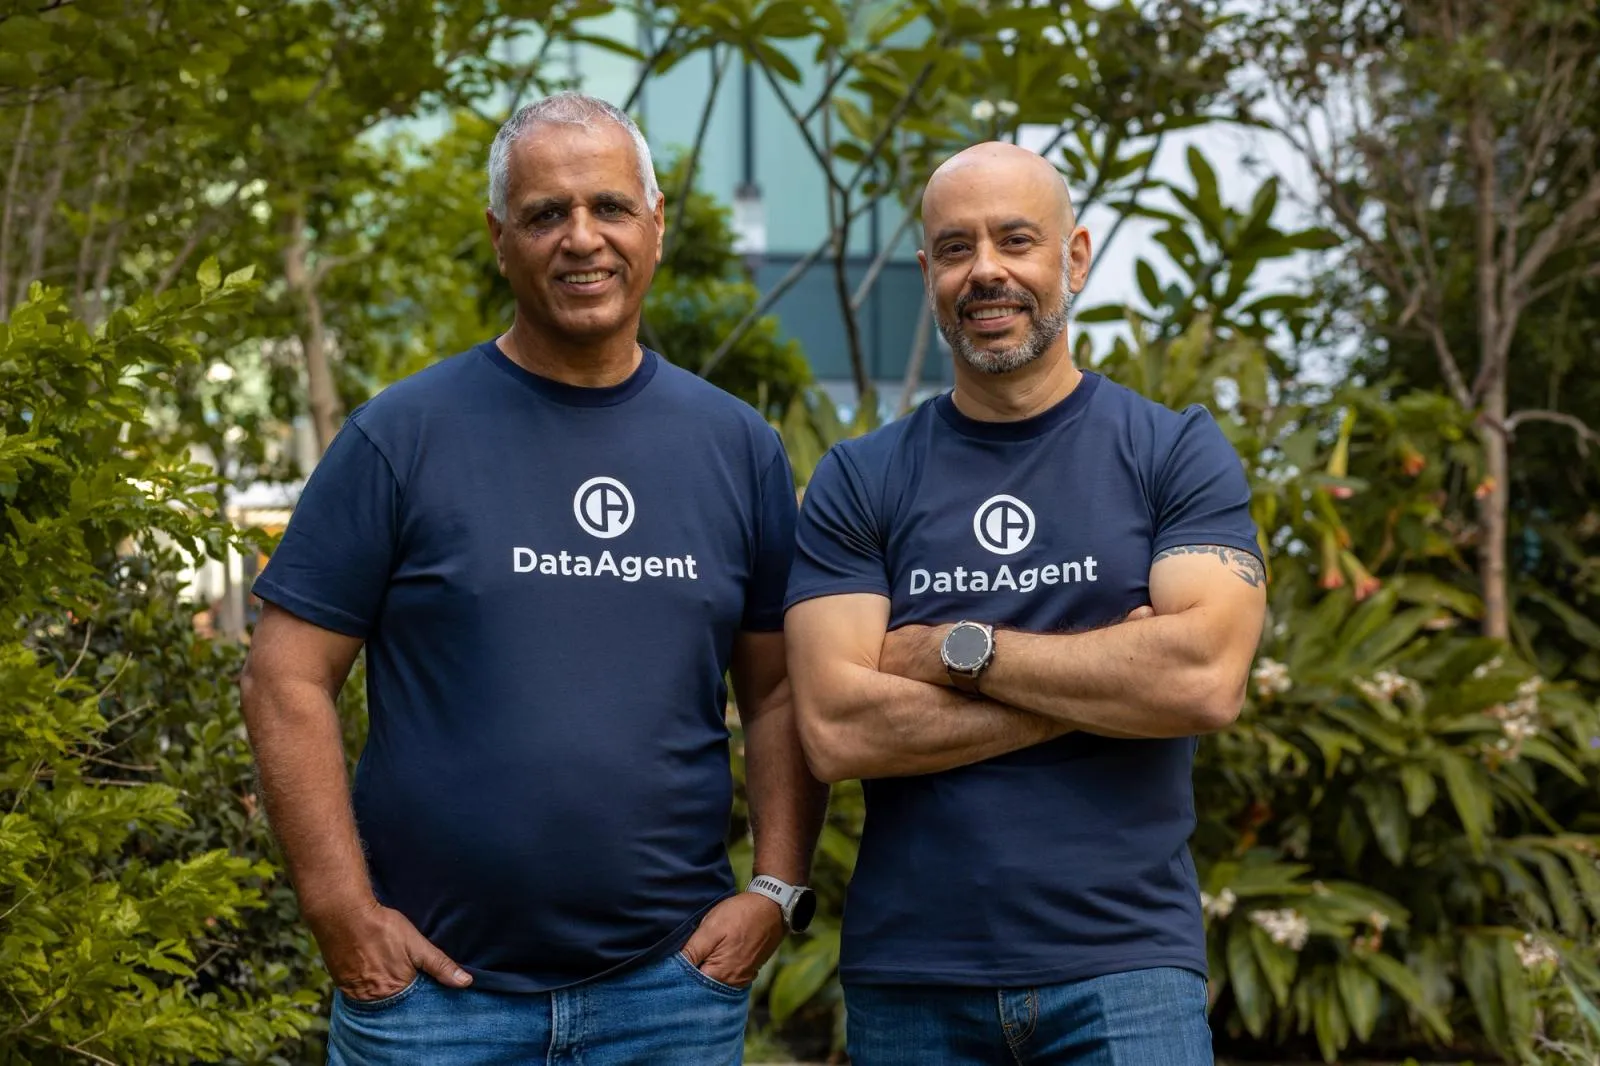 Nati ShalomCo-founder & CTO
Executive Summary
- In 2026 the largest observability vendors conceded the destination. On Datadog's Q2 FY2026 earnings call, CEO Olivier Pomel said "the future of observability is not just observing, it's fixing." Dynatrace announced its Autonomous SRE Agent two weeks earlier.
- That concession creates a structural tension: these vendors bill on ingestion, indexing, and retention. An agent cannot be made to need less data without shrinking the revenue line it runs on. The lake is the revenue.
- Autonomy is not a data problem. The model is the brain; the harness is the body: the tools it can invoke, the state it keeps, the guardrails on what it may do, and the verification of what it did. Only one of those five jobs is fed primarily by telemetry.
- Most production root causes live in control-plane state and change records, not in telemetry. Telemetry tells you a symptom is happening; state and change tell you why.
- The right category question is not "which vendor has AI observability," it is which system is an autonomous control plane, one that closes a sense-act loop and can port its actions across clouds. The test is five questions, listed at the end of this piece.
The concession nobody priced in
For fifteen years, the observability industry sold sensing as the product. You paid to collect, ship, index, and retain. A human read the result.
In 2026 that stopped being the pitch.
Datadog and Dynatrace both reported strong Q2 FY2026 revenue, and both used the moment to announce that fixing, not watching, is where they are heading. Datadog's CEO said it on the earnings call. Dynatrace shipped an Autonomous SRE Agent two weeks before it.
Read those together and the argument is settled at the level of intent. Nobody credible is still claiming that a dashboard is the destination. What remains contested is architecture, and that is the part that actually determines whether an "autonomous" agent works at 3 a.m.
Here is the tension the earnings beat hides. Both vendors bill on the data: ingestion, indexing, retention, per-host, per-series. Autonomy is supposed to escape that. But a fixing agent bolted onto a lake inherits the lake's ceiling, because the vendor cannot make the agent need less data without shrinking its own revenue.
Watch what shipped alongside the pivot. Datadog also introduced Bring Your Own Cloud, running inside the customer's own environment. That is the largest lake vendor in the world conceding that the data wants to stay where it lives.
The beat is a look backward. The pivot is a look forward, at a model in tension with itself.
Why "AI observability" is the wrong category name
There is a naming problem worth clearing up, because it now actively misleads buyers.
Search "AI observability" in 2026 and you will mostly find tools for observing AI systems: LLM tracing, prompt monitoring, model drift, eval pipelines. Arize, WhyLabs, Galileo, Fiddler. That is a real and useful category, and it is close to the opposite of what an autonomous SRE does.
What people usually mean when they say "AI observability" for infrastructure is: the same collect-index-retain pipeline, with a language model reading the output. That is not a new category. That is a new front end.
A category is defined by what a system is for. Observability is for producing an accurate description of what happened, addressed to a human. A control plane is for changing the state of the system to a desired state. Those are different jobs with different architectures. The first optimizes for completeness of the record. The second optimizes for the ability to act correctly, and to prove it acted correctly.
So the honest category name for what the industry is now converging on is not AI observability. It is the autonomous control plane: a system that closes a sense-act loop over production, where sensing exists to serve action rather than to serve a report.
The harness: five jobs, one of them telemetry
When people evaluate an autonomous agent, they evaluate the demo. The demo shows reasoning. Reasoning is the easy part now. Frontier models are good at it and getting better on someone else's budget.
What determines whether an agent survives contact with production is the harness around the model. Five distinct jobs:
1. Tools. What can it actually invoke? Not "what can it recommend," but what can it execute? A kubectl rollout undo, a security-group rule restore, a Terraform apply, an HPA bound change. If the answer is "it opens a pull request," the human is still the actuator and you have bought a faster writer, not an autonomous system.
2. Context. What does it read before it reasons, and what does that cost? This is where most architectures quietly fail. An agent that must correlate metrics, logs, and traces to guess at causality is doing, at machine speed, exactly what a human did in front of a dashboard.
3. State. What does it remember between steps and between incidents? Autonomy over a multi-step remediation requires durable state: what has been tried, what the system looked like before the change, what the intended end state is. A stateless agent cannot safely perform step 4 of a 6-step fix.
4. Guardrails. What is it forbidden from doing, and who decided? Scope of change, environment, blast radius, time-of-day, confidence threshold. Guardrails are not a safety add-on; they are the thing that makes autonomy sellable to an organization that has a change-management process.
5. Verification. How does it know the fix worked? An agent that acts without verifying is worse than no agent, because it has now added an unlogged change to your incident timeline.
Only job #2 is primarily fed by telemetry. Four of the five are body problems. Which is why an architecture optimized end-to-end for telemetry volume is optimized for one fifth of the problem.
Where root causes actually live
This is the part that has the biggest practical consequence, so it deserves specifics.
Traditional APM builds its topology from request traces. That produces an application-shaped map: services, calls, latencies. It is genuinely useful and it systematically misses infrastructure, because infrastructure does not emit request traces. IAM roles do not appear in a span. Neither do VPC endpoint bindings, security-group rules, Kubernetes owner references, admission webhooks, or PodDisruptionBudgets.
But that is where a very large share of production incidents originate: in a change to declared state.
Consider the difference in evidence class:
| Evidence class | Where it lives | What it tells you | Volume / cost profile |
|---|---|---|---|
| Metrics | Time-series store | A symptom is happening now | High cardinality, high cost, continuous |
| Logs | Index / lake | What a process reported about itself | Highest volume, highest cost, continuous |
| Traces | APM store | How a request flowed between services | High volume, app-shaped only |
| Control-plane state | K8s API, AWS Config | What the system is declared to be right now | Small, structured, queryable on demand |
| Change records | CloudTrail, audit log, Git | What changed, when, and who changed it | Tiny, exact, attributable |
The bottom two rows are the cheapest data in your estate and the most causally informative. They are also the two rows a lake-first architecture treats as an afterthought, because you cannot bill much for them.
Correlation over the top three rows gives you "these signals moved together." Causation requires the bottom two: the specific, timed, attributable change. That distinction is the whole basis for whether an agent may safely act, because you cannot autonomously remediate a correlation.
Worked example: the 3 a.m. checkout latency spike
One incident, start to finish, with two different architectures.
02:58. During a routine Terraform apply to tighten network rules, a revoke_security_group_ingress removes port 5432 ingress to the primary RDS security group from the checkout-svc node-group security group. The apply succeeds. Terraform reports no errors. The change is correct according to the plan; the plan was wrong.
03:04. Existing pooled connections are still open, so nothing breaks immediately. As pods recycle, new connections start to fail.
03:06. Checkout p99 latency crosses the alert threshold. The page fires.
What the telemetry actually shows:
- checkout-svc p99 latency: 240ms → 9.8s
- Application logs:
psycopg2.OperationalError: connection to server at "prod-orders.…rds.amazonaws.com" (10.0.14.22), port 5432 failed: Connection timed out - RDS
DatabaseConnections: flat, then declining - RDS CPU, memory, IOPS: normal
- Traces: the outbound DB span simply times out at the client deadline
- Kubernetes: pods Running, 1/1 ready, and the readiness probe checks
/healthz, which does not touch the database
Path A: the lake-first agent. It correlates across metrics, logs, and traces. It finds a latency spike, connection timeouts, and a healthy database. Its most likely hypotheses, ranked by what the telemetry supports: connection pool exhaustion, a DNS resolution problem, a noisy-neighbor node issue, or an RDS-side limit. Every one of those is a defensible read of the evidence, and every one is wrong. The reason is not that the model reasoned badly. It is that the cause is not present in the data it was given. Connection timeouts look identical whether the packet was dropped by a security group, a network policy, a missing route, or a saturated NAT gateway. The telemetry cannot distinguish them, so neither can anything reading only telemetry. So it escalates with a summary, at which point you have paid for machine-speed dashboarding.
Path B: the control-plane-first agent. Same symptom, different first question: what changed in the blast radius, and when?
It scopes the blast radius from declared state: checkout-svc → its service account → its node group → the security groups attached → the RDS instance those groups reference. Then it queries the change record over the window [03:06 − 30m, 03:06] and gets exactly one mutating event inside that radius:
eventTime:      2026-08-19T02:58:41Z
eventName:      RevokeSecurityGroupIngress
userIdentity:   arn:aws:sts::…:assumed-role/terraform-ci/…
requestParameters:
  groupId:      sg-0a41…  (rds-prod-orders)
  ipPermissions: { fromPort: 5432, toPort: 5432, protocol: tcp,
                   userIdGroupPairs: [ sg-0c9e…  (eks-checkout-ng) ] }
One query. Effectively free. Unambiguous, timed, and attributable to a specific principal.
Now the fix is deterministic rather than probabilistic. Restore that one rule, verify that new connections succeed, and verify that p99 returns to baseline, then hand engineers a complete evidence chain explaining that a CI-driven network-tightening change removed a database ingress path, along with the reason CI did not catch it: the integration test suite mocks the database.
The difference between the two paths is not model quality. It is what the agent read before it reasoned, and what that read cost.
Multi-cloud: port the action, not the data
There is a second-order consequence worth naming, because it inverts the standard multi-cloud pitch.
The incumbent argument for multi-cloud goes: normalize everything into one schema, in one lake, so you can see across clouds. That means every additional cloud increases the volume you move and store, and the value arrives only after the normalization is complete.
An autonomous control plane has the opposite shape. What needs to be portable is not the data; it is the action. restart this workload, roll back this deployment, restore this network rule, scale this group are the same six or seven verbs on every provider, expressed through different APIs. Sensing and acting both happen close to the resource; only small, summarized signals and outcomes cross a boundary.
That is a genuinely different multi-cloud strategy: multi-cloud action portability rather than multi-cloud data centralization. It also happens to be the only one that gets cheaper rather than more expensive as you add a cloud.
Where DataAgent fits
Everything above is an architecture argument that stands on its own. This section is where we say what we built, so you can judge it against the argument.
DataAgent is built on an autonomous control plane architecture rather than as an observability platform with an agent attached. Concretely:
- TIDE (Topology & Infrastructure Drift Evidence) is Layer 0: a versioned graph of entities, configuration, relationships, and drift history, read directly from control planes. Kubernetes owner references, IAM roles, VPC bindings. Topology from declared state, not from request traces, which is what makes the security-group path in the worked example reachable at all.
- Read-in-place sources are Layer 2. Raw telemetry stays where it is produced and is fetched ad hoc at full fidelity, only for the blast-radius window. No second paid copy, no egress.
- The Fault Ladder is the discipline of action: Detect (PULSE) → Enrich (TIDE) → Diagnose (SURGE) → Gate (STEER) → Act (RAPS) → Learn (WAKE). A fault enters at the bottom and graduates up the rungs.
- The Trust Ladder is the guardrail layer. A fault class earns autonomy only after verified successes on that class; everything unproven routes to a human. Nobody hands a generic model the keys to production, and nobody should.
- Order of operations is inverted relative to convention: a deterministic circuit breaker stabilizes within seconds, and the deep root-cause analysis runs in parallel in the background. The analysis waits for your engineers, not the other way around.
We deploy AWS-native, in-cluster, with no third-party observability layer required, and we run alongside your existing tools rather than replacing them. If you already run Datadog or Dynatrace, they remain a signal source; DataAgent adds the action layer.
The five-question harness test
Next time you evaluate an autonomous announcement, ours included, skip the demo and ask about the body:
- Tools: What can it execute directly, and what does it merely propose to a human?
- Context: What does it read before it reasons? Does that include declared state and change records, or only telemetry?
- State: What does it remember between steps of a multi-step remediation, and across incidents?
- Guardrails: Who defines the limits, at what granularity, and can you prove the limits held?
- Verification: How does it know the fix worked, and what does it do when the fix did not work?
If the answers to 1, 3, 4, and 5 are thin and the answer to 2 is "all of your telemetry," you are looking at observability with an agent bolted on. That may still be a good product. It is not an autonomous control plane.
FAQ
Is an autonomous control plane just observability with a different name?
No. They optimize for different outputs. Observability optimizes for a complete, accurate record addressed to a human reader, which is why its cost scales with data volume and retention. A control plane optimizes for the ability to change system state correctly and prove it, which is why its cost scales with the number of fault classes it handles. You can build the second on top of the first, but you inherit the first's cost structure and its blind spots.
Why does my AI incident tool keep suggesting the wrong root cause?
Usually because the cause is not in the data it was given. Connection timeouts, 502s, and elevated latency are symptom classes with many possible causes that look identical in telemetry. Distinguishing them requires declared state and change records: a security-group rule, a network policy, an IAM policy version, an admission webhook, a deploy. If your tool reads only metrics, logs, and traces, it is structurally unable to separate those cases, no matter how good the model is.
Can't a vendor that bills on ingestion just build a good agent anyway?
Technically yes; commercially it is a hard trade. The more effective the agent, the less telemetry needs to be retained warm for human browsing, which is the revenue line. Bring Your Own Cloud deployments are the visible edge of that tension: the architecture is being pulled toward the data's location while the pricing model still rewards moving it.
Does an autonomous control plane replace Datadog or Dynatrace?
It does not have to, and in most estates it should not on day one. The practical pattern is to keep the incumbent as a signal source and add the action layer alongside it, then let the economics decide over time. That is why we ship AWS-native with no observability prerequisite, and also accept existing tools as inputs.
How is "port the action, not the data" different from a normal multi-cloud story?
The usual story centralizes: normalize telemetry from every cloud into one schema in one place. Cost grows with each cloud added. Action portability distributes: sense and act close to each resource, and move only small signals and outcomes across the boundary. The set of remediation verbs is nearly identical across providers even though the APIs are not, so the portable layer is the verb set, not the schema.
What is the shortest way to tell a real autonomous system from a demo?
Ask what it reads before it reasons, and what happens after it acts. Those two answers, context and verification, separate almost everything on the market today.
Key takeaways
- The category argument is over: every major vendor now agrees fixing is the point. The remaining argument is architectural, and architecture is what fails at 3 a.m.
- A fixing agent built on a billed-by-ingestion lake inherits that lake's ceiling. The incentive to make the agent need less data runs against the revenue model.
- Reasoning is commoditized. The harness (tools, context, state, guardrails, verification) is the differentiator, and only context is telemetry-shaped.
- Telemetry describes symptoms. Declared state and change records explain causes, cost almost nothing to query, and are what makes deterministic remediation possible.
- In an action-first architecture, multi-cloud means porting a small set of remediation verbs, not centralizing everyone's telemetry.
- #Autonomous Control Plane
- #Observability
- #SRE
- #Kubernetes
- #AWS
- #Root Cause Analysis
See remediation-first in your own stack
Install an agent and watch DataAgent map your topology. No credentials, no commitment.
Keep reading
 Engineering7 min
What You Won’t Hear at ObservabilityCON
The stage shows an AI agent on top of your data cloud. The people who carry the pager, when no vendor is in the room, describe something else: an agent that goes to the data, a backend that becomes storage, and a bill that stops charging for a reader who has left.
Nati Shalom • Oct 15, 2026 Engineering14 min
Who Pays for the Dashboard?
We priced one Kubernetes-on-AWS workload across observability backends. Copying telemetry into a SaaS platform costs 5–9× the open-source floor, and an autonomous agent uses none of what the premium buys. Build the substrate cheap; fund the loop.
Nati Shalom • Oct 11, 2026 Engineering11 min
Is AI Making Your SRE Team Better? Ask the Scale, Not the Mirror
AI makes engineers faster at producing changes and makes production less stable. Which effect wins depends on your platform. Four production numbers tell you whether AI is actually making your SRE team better.
Shahar Harap • Oct 11, 2026