Precision vs. Recall: Why Observability Costs So Much
Observability bills are shaped by one unstated assumption: a human might need to scroll back. That is collection optimized for recall. An agent present at the moment of the fault optimizes for precision — and precision scales with your incident rate, not your estate.
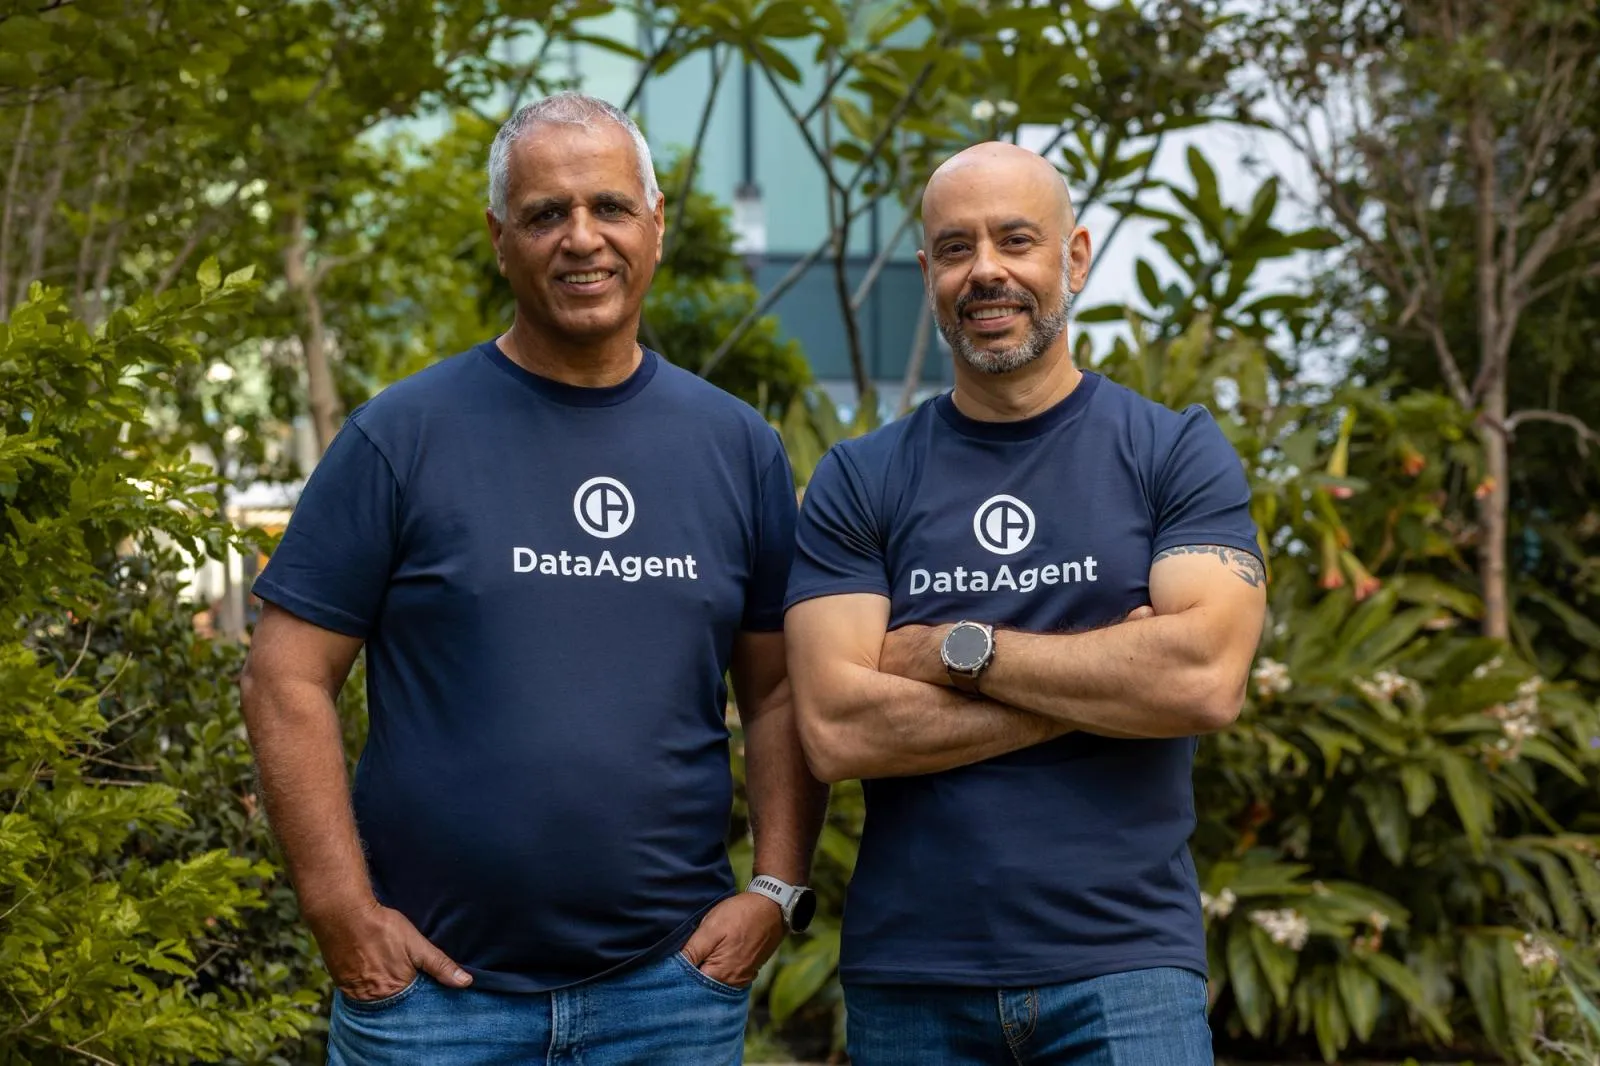 Nati ShalomCo-founder & CTO
Executive summary
- The reason the bill is that shape is a design assumption nobody states out loud: every observability stack is built around a human who might one day need to scroll back. That assumption is what forces you to collect everything, index everything, and keep it warm.
- In information-retrieval terms, human-oriented collection optimizes for recall — have everything, just in case. An autonomous agent optimizes for precision — fetch exactly the evidence that discriminates between hypotheses, at the moment of the fault.
- Those two objectives produce different bills. Recall scales with your estate. Precision scales with your incident rate and the number of fault classes you handle.
- The savings do not come from procurement. They come from no longer paying to warehouse data nobody opens. Roughly half of collected metrics are never queried, and for logs, industry estimates run considerably higher.
- The practical order of operations: stop paying twice for the same bytes, then cut cardinality, then move retention from insurance to evidence. In that order, because that is the order of the money.
The line that only moves one way
For ten years the observability line item has moved in exactly one direction, and faster than the systems it watches. It is a monitoring tax that quietly outgrew the thing being monitored.
The 2026 numbers bear this out, and they are more interesting than a simple "it's expensive" complaint. Some vendors claim their bills went down, but industry figures tell a different story. Observability came in at an average of 17% of total compute infrastructure spend. But the top-cited concern for 2026 was not cost at 31%, nor signal-to-noise at 34%, it was complexity and overhead, at 38%.
That ordering matters. It tells you the industry has stopped treating this as a pricing problem and started treating it as an architecture problem. You cannot negotiate your way out of complexity.
Here is the part nobody is pricing in: that line is about to bend the other way. Not because a cheaper vendor showed up. Because of what you were actually buying all along.
The assumption underneath the bill
Ask why you retain 30 days of logs at full fidelity. The honest answer is not "because we query them." It is: because if something goes wrong, an engineer might need to scroll back, and we won't know in advance what they'll need.
That is the load-bearing assumption of the entire category. Not a bad assumption — it was correct for as long as the diagnosing agent was a human being with no ability to go back in time and ask for more.
Follow it forward and every cost driver in your bill is a direct consequence:
- You collect everything, because you cannot predict which field the human will need.
- You index everything, because the human needs to search interactively, at conversational speed.
- You keep it warm, because a human investigating at 3 a.m. will not wait 40 minutes for a restore from cold storage.
- You keep high cardinality, because the human will want to slice by
pod,customer_id,regionandbuild_shain a combination nobody anticipated. - You retain for 30 or 90 days, because the human might be investigating something that started three weeks ago.
Every one of those is insurance against human diagnostic uncertainty. You are not paying for insight. You are paying for an archive sized for human browsing.
Now take the human off the dashboard.
Precision and recall, borrowed properly
Information retrieval has precise words for this trade-off, and they map onto the problem exactly.
Recall is: of all the relevant evidence that exists, how much did I capture? Human-oriented telemetry maximizes recall. It has to. The human does not know in advance what will turn out to be relevant, cannot re-run history, and gets one shot at whatever was retained.
Precision is: of what I captured, how much is actually relevant? An autonomous agent operating at the moment of the fault can optimize for precision instead, for three structural reasons:
- It is present when the fault occurs. It does not need a historical archive to reconstruct the moment; it can request full-fidelity data at that moment, from the source.
- It can ask follow-up questions. A human reading a dashboard is limited to what was collected. An agent can query the Kubernetes API, pull a specific container's logs for a 90-second window, run
kubectl describe, or read a CloudTrail event — iteratively, guided by a hypothesis. - It knows the structure of the system. Given a versioned topology graph, it does not need to search broadly; it knows which twelve objects are inside the blast radius and can ignore the other forty thousand.
An agent that can ask a follow-up question does not need an archive. Retention was a substitute for the ability to ask.
This is the core reframe, and it has a testable consequence: precision-oriented collection is cheap in steady state and expensive only during a fault — which is to say, expensive rarely and briefly, in proportion to incidents rather than to estate size.
| Human-oriented (recall) | Agent-oriented (precision) | |
|---|---|---|
| Objective | Capture everything potentially relevant | Capture what discriminates between hypotheses |
| Steady-state fidelity | Full, continuous | Coarse, low-volume |
| Fidelity at a fault | Whatever was retained | Full, on demand, scoped to blast radius |
| Retention driver | How far back a human might scroll | How long an evidence chain must be auditable |
| Cardinality driver | Every slice a human might want | The dimensions the topology graph says matter |
| Cost scales with | Size of estate × retention window | Incident rate × fault classes covered |
| Failure mode | Paying for data nobody opens | Missing an unanticipated fault class |
That last row is the honest cost of this approach and I will not pretend otherwise. A precision architecture has a real failure mode: a fault class you have not modelled produces less forensic residue than a maximal-retention setup would have. Which is exactly why the sane migration path is additive — keep coarse always-on signals, add fault-triggered fidelity, and shrink retention only where the evidence chain proves sufficient.
Where the money actually is, in order
Three cost mechanics, ranked by how much they typically return.
1. You are paying twice for the same bytes
This is the plainest one and the least defensible. Your cloud provider produces telemetry and charges you to store it — CloudWatch, VPC flow logs, CloudTrail, RDS logs. Then you pay an agent to read it, a pipeline to move it, egress to leave the network, and a third-party vendor to index and store a second copy of data that already exists, durably, where it was produced.
There is no technical reason a second copy must exist. It exists because the querying tool historically could not read the first copy at interactive speed. Read-in-place architectures remove that constraint, and with it the duplicate storage, the egress, and most of the pipeline.
Datadog's own Bring Your Own Cloud offering is the clearest possible admission of this: the largest lake vendor in the world building an option where the data stays in your environment.
2. Cardinality, not volume, is the line item that surprises you
Most teams budget in gigabytes. Metric platforms bill on active time series, and a time series is created for every unique combination of label values. That is a multiplication, not an addition.
A single innocuous metric:
http_request_duration_seconds{
  service, method, route, status_code, pod, node, region, version
}
With 40 services × 5 methods × 30 routes × 8 status codes × 6 pods × 3 regions × 4 live versions, that one metric name yields on the order of 3.5 million active series. Add a histogram with 12 buckets and it is over 40 million.
The two labels doing the real damage are pod and version, because both are unbounded over time. Every deploy, every scale event, every OOMKill-and-reschedule mints new label values. Your series count grows with your deploy frequency, which is to say it grows with the thing you were trying to get better at.
Two questions worth running against your own estate this week:
- How many active series are you paying for, and how many appear in any dashboard or alert rule? (In most estates the second number is a small fraction of the first.)
- Which of your labels are unbounded over time? Those are your cardinality bill.
The reason a human-oriented stack cannot fix this without pain is that any label you drop is a slice somebody might have wanted. An agent working from a topology graph does not need pod as a metric label at all — it can resolve pod identity from declared state when it needs it, which is only during an incident.
3. Retention is insurance, and you can now buy less of it
Industry experience consistently shows roughly half of collected metrics are never queried or acted on, and for logs the unused proportion runs higher still.
The usual response is a data-reduction project: sampling rules, drop filters, tiering, a pipeline tool. Those work, and they are also why complexity outranked cost as the #1 concern for 2026 — you have added a system whose job is to manage the cost of another system. Grafana's own respondents report juggling many tools across a sprawling technology surface; each cost-control layer is another one.
The structural version of the fix is different: reduce the reason for retention. If the evidence chain for an incident is assembled at the moment of the incident — declared state, the change record, and full-fidelity signals pulled for the blast-radius window — then what you retain afterwards is a compact, auditable evidence chain rather than a haystack you might one day search.
Retention stops being insurance against uncertainty and becomes a record of what actually happened. That is a much smaller object.
Worked example: one week, one team, the same bill twice
A mid-sized team on EKS. Roughly 40 services, three regions, about 15 deploys a day. What steady state costs, and what an incident actually needs.
The recall-shaped week. Continuous full-fidelity collection across the estate: application logs at DEBUG in two namespaces because somebody was debugging in March and never reverted it; Prometheus scraping every 15 seconds with pod and version labels on the request histogram; VPC flow logs on; 30-day warm retention on all of it; an OpenTelemetry collector fleet plus a vendor agent per node. Volume for the week is dominated by data produced during the ~167 hours nothing was wrong.
The incident. On Wednesday at 03:06, checkout p99 goes from 240ms to 9.8s. Here is what was actually needed to diagnose and fix it:
- The blast radius from declared state: checkout-svc → service account → node group → attached security groups → the RDS instance those groups reference. 12 objects.
- Mutating change events inside that radius, window [02:36, 03:06]. One event — a
RevokeSecurityGroupIngressat 02:58 removing port 5432 from the node-group security group, executed by the CI role. - Full-fidelity logs for checkout-svc, one 90-second window, to confirm the symptom class:
psycopg2.OperationalError: connection to server at "prod-orders.…rds.amazonaws.com" (10.0.14.22), port 5432 failed: Connection timed out. - Three metric series to confirm the fix landed: checkout p99, RDS
DatabaseConnections, and pod-level connection error rate.
That is the whole evidence set. Twelve objects, one change record, one 90-second log window, three series. Everything else collected that week contributed nothing to the resolution — and would not have, no matter how carefully a human had searched it, because the causal fact lived in the change record rather than the telemetry.
The recall architecture paid for 167 hours of continuous fidelity to have that 90-second window available. A precision architecture pays for coarse always-on signals plus one burst of full-fidelity retrieval, triggered by the fault.
Same incident. Same resolution. Two very different bills, for one reason: one of them was priced for a human who might scroll back, and no human ever did.
Where DataAgent fits
Everything above holds whether or not you ever talk to us. What we built, so you can judge it against the argument:
- Read-in-place sources. Raw telemetry stays where it is produced. DataAgent reads AWS (CloudTrail, Config, CloudWatch) and Kubernetes state natively, in place, and fetches full fidelity ad hoc — only for the blast-radius window. No second paid copy, no egress, no data tax.
- In-cluster processing. Lightweight agents run on your clusters and analyze signals at the source. Only small, summarized signals leave. That is the same mechanism that makes it secure-by-design: sensitive logs and traces never leave your perimeter.
- Fault-driven fidelity (PULSE). Thin, low-data in-cluster detection in steady state, emitting a labelled stream. Full resolution is spent where and when a fault is actually unfolding.
- Topology-scoped retrieval (TIDE). A versioned graph of entities, configuration, relationships and drift history means the agent knows which twelve objects matter, so it never needs
podas a permanent metric label to find a pod. - No observability prerequisite. DataAgent is AWS-native and does not require a third-party observability layer to function. Run it standalone, or alongside your existing tools as an enhancement — no rip-and-replace, no vendor lock-in.
Publicly stated numbers on our side: 80% cost reduction from analyzing telemetry locally, 0× extra observability stack required, and 99% MTTR reduction, hours to seconds, with a deterministic circuit breaker that responds in seconds without waiting for root-cause analysis.
FAQ
Why does observability cost so much?
Because it is priced for maximum recall on behalf of a human investigator. Collecting everything, indexing everything, keeping it warm and retaining it for weeks are all consequences of not knowing in advance which field an engineer will need at 3 a.m. Those four decisions, not vendor pricing, are what set the bill's shape.
How much of my observability data is actually used?
Industry experience routinely puts around half of collected metrics as never queried or acted on, with logs typically worse. The fastest way to find your own number is to list your active time series, then list the series referenced by any dashboard or alert rule, and compare the two.
Is this just data reduction with extra steps?
No, and the difference is worth being precise about. Data reduction keeps the recall objective and tries to spend less achieving it — sampling, drop rules, tiering, a pipeline tool to manage it all. That works, and it adds a system. Changing the objective to precision removes the reason for the volume in the first place. You can do both; only one of them reduces the number of tools you operate.
What actually drives a high Kubernetes metrics bill?
Cardinality, not gigabytes. Metric platforms bill on active time series, which is the product of every label's distinct values. The usual culprits are labels that are unbounded over time — pod, version, build_sha, container_id — because every deploy and every reschedule mints new series. High deploy frequency then compounds it.
Won't I regret cutting collection the first time something unexpected breaks?
That is the real trade, and it is why the migration should be additive rather than a cutover. Keep coarse always-on signals so nothing goes dark, add fault-triggered full-fidelity retrieval, and shrink retention only in the places where the assembled evidence chain has proven sufficient. Shrink retention last, not first.
Can I get these savings without replacing my current vendor?
Yes, and that is the normal starting point. Run an agent-native layer alongside the incumbent, keep the incumbent as a signal source, and let the retention and cardinality numbers move on their own before anyone has a procurement conversation.
Key takeaways
- Observability averages 17% of compute infrastructure spend, and for 2026 the top-cited concern is complexity and overhead at 38%, ahead of cost. That makes it an architecture problem, not a negotiation.
- Every cost driver in the bill descends from one assumption: a human might need to scroll back. That is insurance against human diagnostic uncertainty, not payment for insight.
- Human collection optimizes recall; agent collection optimizes precision. Recall scales with your estate, precision scales with your incident rate.
- Attack the money in order: stop paying twice for the same bytes, then cut unbounded-cardinality labels, then reduce retention — last, and only where the evidence chain proves sufficient.
- An agent that can ask a follow-up question at the moment of the fault does not need an archive. Retention was a substitute for that ability.
- #Observability
- #Cost Optimization
- #SRE
- #Cardinality
- #AIOps
- #Kubernetes
See remediation-first in your own stack
Install an agent and watch DataAgent map your topology. No credentials, no commitment.
Keep reading
 Engineering7 min
What You Won’t Hear at ObservabilityCON
The stage shows an AI agent on top of your data cloud. The people who carry the pager, when no vendor is in the room, describe something else: an agent that goes to the data, a backend that becomes storage, and a bill that stops charging for a reader who has left.
Nati Shalom • Oct 15, 2026 Engineering14 min
Who Pays for the Dashboard?
We priced one Kubernetes-on-AWS workload across observability backends. Copying telemetry into a SaaS platform costs 5–9× the open-source floor, and an autonomous agent uses none of what the premium buys. Build the substrate cheap; fund the loop.
Nati Shalom • Oct 11, 2026 Engineering11 min
Is AI Making Your SRE Team Better? Ask the Scale, Not the Mirror
AI makes engineers faster at producing changes and makes production less stable. Which effect wins depends on your platform. Four production numbers tell you whether AI is actually making your SRE team better.
Shahar Harap • Oct 11, 2026