DataAgent vs. Grafana Cloud: Where Observability Stops and Remediation Begins
See where Grafana Cloud's observability stops and where DataAgent's autonomous remediation picks up, with a fault-by-fault breakdown.
 DataAgentCompany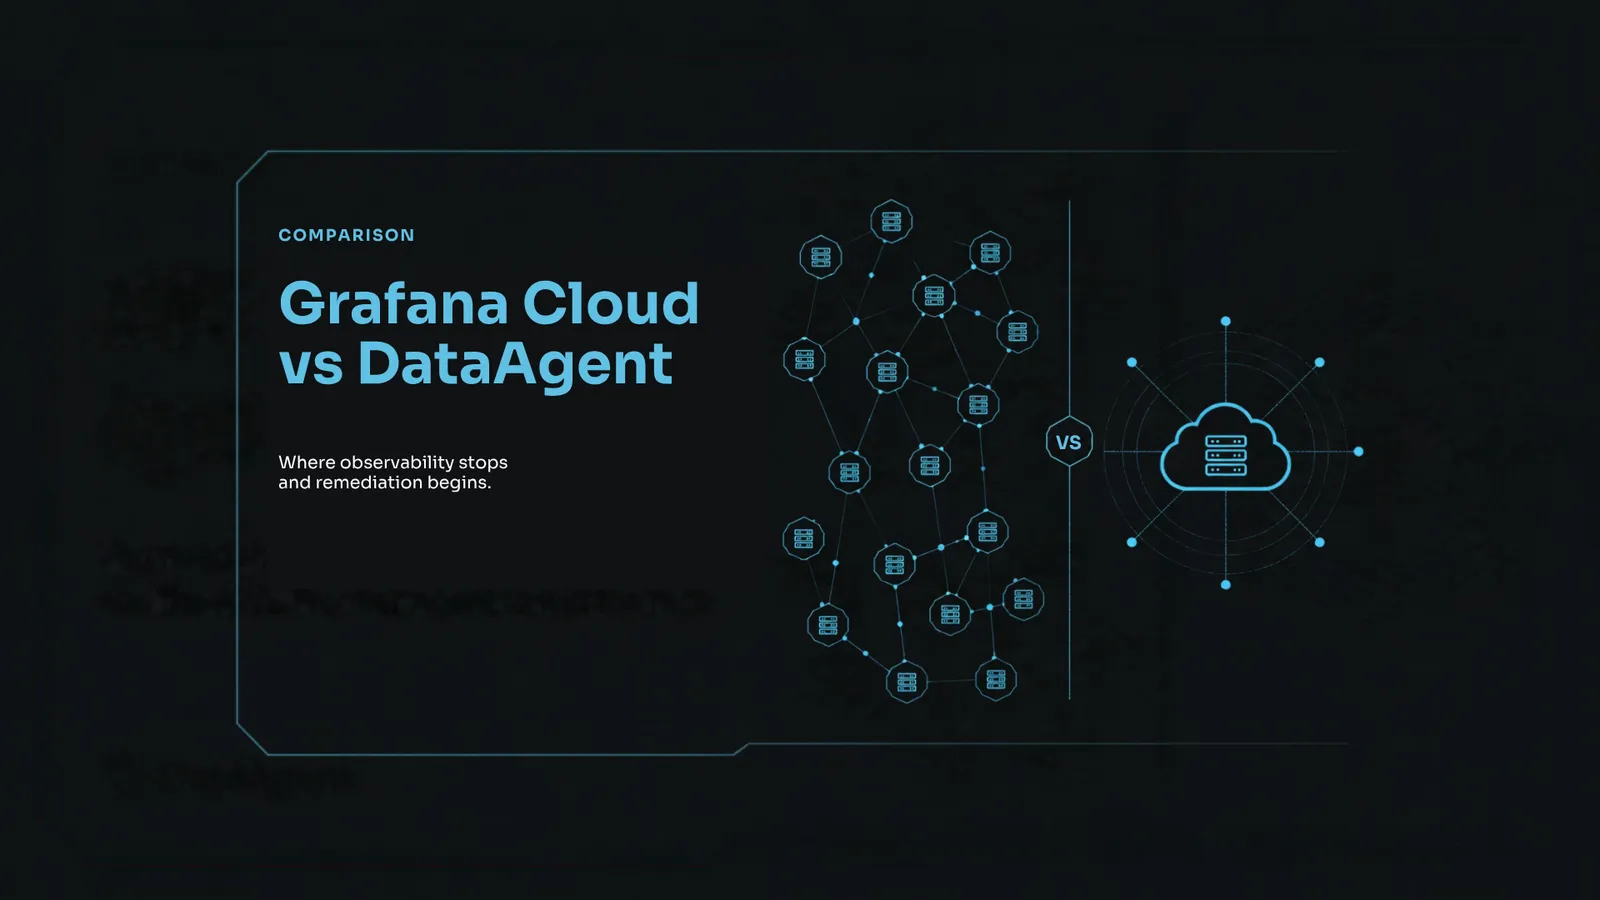
Quick answer: Grafana Cloud is the strongest open, multi-source sensor layer on the market: hundreds of data source plugins, mature symptom detection through Sift and Asserts, a genuinely effective cost-reduction suite in Adaptive Telemetry, and, as of July 2026, a real act step through Assistant Investigations, with Watcher agents in public preview. The difference that remains is how autonomy gets earned. Grafana's Watcher agents (public preview) hand a firing watcher to Assistant to remediate, with autonomy a team tests and confirms one behavior at a time; DataAgent, an autonomous SRE platform, proves each fault class against injected, answer-keyed failures in a sandbox (the Fault Ladder) before it's trusted to act broadly, and it reads Kubernetes and AWS control-plane state directly, including CloudTrail, IAM, and the K8s audit log, not just what's already inside Grafana's own stack. Most teams don't have to choose. DataAgent reads Grafana's own stack (Mimir, Loki, Tempo) as a signal source and runs alongside it, no rip-and-replace required. And you see the value before you commit: a read-only deployment produces a fault-coverage report and a cost-savings analysis before DataAgent is given permission to act.
Grafana earns its position, and this comparison isn't premised on it being weak, or standing still. It built the open, vendor-neutral sensor layer the industry standardized around, and Sift, Asserts, and Adaptive Telemetry are all real, shipping products. Grafana Labs also moved fast in 2026: its July "AI Week" shipped six AI tools at once, including Assistant Investigations, a genuine step toward autonomous action, and Watcher agents followed in public preview. The sections below go dimension by dimension: a short explanation of what's being compared, how Grafana Cloud handles it, and how DataAgent handles it.
Architecture
The architecture a platform is built on decides almost everything downstream of it: cost, RCA depth, and how fast a fix can ship. The core question is whether analysis happens after data is centralized into a vendor's own store, or directly against the systems producing it, and how much data gets collected "just in case" versus fetched only when it's actually needed.
How Grafana Cloud handles it
Grafana centralizes telemetry into its own store (Mimir for metrics, Loki for logs, Tempo for traces, Pyroscope for profiles) before Sift, Asserts, or the Assistant can analyze any of it. This is a "ship-then-think" model: data moves first, intelligence runs second. Because a human might query any of it later, the default posture is broad collection and retention, Adaptive Telemetry is a real improvement, but it largely optimizes data that's already being sent to Grafana.
How DataAgent handles it
DataAgent deploys lightweight agents directly inside your clusters and reads Kubernetes and AWS control-plane state in place, at the source, at the moment a fault occurs. Nothing has to be shipped anywhere before analysis starts, and nothing has to be retained "just in case" a person wants to look later. Fidelity runs lean in steady state and rises to full resolution exactly where and when a fault is unfolding, so the detail is highest at the moment it's actually needed, not averaged down in advance to keep a bill survivable.
Cost Model
As Grafana Labs put it when launching Adaptive Profiles, "the fundamental problem with observability economics today is that cost scales with ingestion, not insight." That's the right diagnosis of the industry's cost problem. The two platforms differ in where they apply the fix.
How Grafana Cloud handles it
Adaptive Telemetry, which as of August 2026 spans all four signals (metrics, logs, traces, profiles), largely optimizes the data sent to Grafana based on how it's used, for example aggregating underused metrics into lower-cardinality versions. Grafana reports real results here: customers including Mux, SailPoint, TeleTracking, and Auditboard have cut telemetry spend by an average of 30 to 50%. The catch is that this is a single-vendor, largely usage-based cut: it reduces what you pay Grafana for data already sent to Grafana. It doesn't reach telemetry duplicated across other vendors, and it doesn't touch AWS-native data (CloudWatch, OpenSearch) that never routes through Grafana at all.
How DataAgent handles it
DataAgent reduces ingestion before it happens, at the source, which makes the cut cross-vendor by construction rather than tied to one platform's billing. For a team that has already deployed Adaptive Telemetry, the additional room comes largely from cross-vendor redundancy, AWS-native ingestion Adaptive never sees, and incident-aware fidelity (full detail while something is actually breaking, lean the rest of the time). By processing data inside your environment and focusing on essential Golden Metrics, DataAgent is potentially reducing observability costs by up to 90%, and a read-only deployment maps your existing telemetry, including overlap and redundancy, into a cost-savings analysis before any commitment.
MTTR Reduction
Investigation speed and remediation speed both roll up into the one number leadership actually tracks: mean time to resolution. It's worth separating the two, because a platform can cut one without touching the other.
How Grafana Cloud handles it
Sift, Asserts, and the newer Assistant Investigations genuinely cut the time to find a cause, and that's real value. But the fix half of MTTR still runs on human time for anything outside a Watcher agent a team has already built, tested, and confirmed: someone has to read the finding, decide, and execute it, or approve the change Assistant drafted. Diagnosis gets faster; the action step still generally waits on a person being available.
How DataAgent handles it
DataAgent decouples stabilization from full root-cause analysis. A fast, deterministic circuit-breaker fires in seconds to stabilize a fault class while the deeper SURGE root-cause analysis keeps running in the background, so time-to-mitigate isn't waiting on a complete diagnosis or a person picking up a page. This is the remediation-first approach: fix first, investigate later.
Root Cause Depth
This dimension is about whether the platform hands a human a finding, or carries it through to a fix, and it's the one that's moved the most since this comparison was first written.
How Grafana Cloud handles it
Sift and Asserts remain the automated ML investigation layer: correlation, error-pattern clustering, entity-level RCA. Sift's error-pattern log clustering and noisy-neighbor analysis are genuinely Grafana's strongest ground. In late July 2026, Grafana also made Assistant Investigations generally available, describing the goal as "human on the loop auto-remediation," and launched Watcher agents in public preview: they monitor continuously, and a firing watcher can be handed to Assistant to remediate. Coverage of the launch describes Watchers acting autonomously once a team has tested and confirmed a specific behavior. That's genuine progress. The autonomy is earned per watcher, by a person testing and signing off on one defined situation at a time, rather than proven against a broad, pre-built catalog of failure scenarios before it's trusted in production.
How DataAgent handles it
DataAgent runs a closed loop: PULSE detects, TIDE enriches with topology and drift evidence, SURGE produces the root-cause chain-of-thought, STEER gates the proposed fix against trust thresholds earned per fault class (the Fault Ladder), RAPS executes the verified playbook, and WAKE learns from the confirmed outcome. The difference from Grafana's model isn't whether either platform can be made to act, both now can, it's what has to happen before it's trusted to: DataAgent proves a fault class against an injected, answer-keyed failure in a sandbox before granting it autonomy broadly, rather than relying on one team's manual test of one specific situation. A fault class that hasn't earned that proof yet routes to a human instead of acting unverified.
Copilot vs. Autonomous Remediation
Separate from whether a fix is possible at all is the day-to-day interaction model: does a person have to be in the loop reading a chat response and clicking approve, or does the system act on its own for what it's already proven it can handle.
How Grafana Cloud handles it
Grafana Assistant is, at its core, a conversational copilot: you ask it a question or task it with an investigation, in Grafana Cloud, Slack, Teams, or via MCP, and its actions run through Grafana's existing permissions and auditing layers. Assistant Automations, GA the same week as Investigations, schedules those same chat prompts to run on a timer, useful for a recurring digest or a routine check, not for closing an incident. Watcher agents, in public preview, are the exception built for standing autonomy: once a team has tested and confirmed one for a specific situation, it can act without a human approving that instance each time, but a person authored, tested, and confirmed it first.
How DataAgent handles it
There's no chat window sitting between detection and the fix by default. STEER gates action against trust thresholds earned per fault class, so once a class has proven itself through sandbox fault injection and the customer has enabled autonomous action for it, DataAgent acts on it directly in production without waiting for someone to read a chat response and approve it, and it still routes anything unproven to a human rather than guessing.
Cloud Control-Plane Reach
Some of the most common causes of outages never show up as a clean application metric: a revoked IAM permission, a denied RBAC request, a config change nobody flagged. Finding those requires reading a cloud provider's own change and permission records, not just its telemetry.
How Grafana Cloud handles it
Sift's analyses run primarily on Prometheus and Loki data, a symptom view at best. Nothing in its documentation indicates it reasons over CloudTrail (AWS's own change record), IAM (who has permission to what), or the Kubernetes audit log. Assistant Investigations broadens what gets investigated, metrics, logs, traces, profiles, services, and labels, but nothing in Grafana's public documentation indicates it reasons over cloud IAM or audit-trail data specifically.
How DataAgent handles it
DataAgent reads CloudTrail, IAM, and the K8s audit log directly, and attributes fault classes that never surface as a clean CloudWatch metric: an IAM permission silently revoked, an RBAC denial that only shows up as a 403 in the audit trail, a config drift traced back to the exact change and the exact actor.
Alert Noise & Incident Grouping
A platform that surfaces every anomaly as its own alert creates a different kind of toil: a dozen pages for the same root cause instead of one page that says what actually broke.
How Grafana Cloud handles it
Grafana Alerting groups notifications by label and routing policy, which teams configure and tune themselves, and Grafana IRM adds incident coordination once something's been declared. Sift's error-pattern clustering helps during an investigation by grouping related log noise. The grouping logic is largely something your team defines up front rather than something that reasons about your system's live dependency graph.
How DataAgent handles it
Incidents are grouped by topology proximity, not just metric correlation. A database issue and the five downstream services it's affecting collapse into one incident automatically, because the grouping is based on the actual dependency graph TIDE maintains, not a label-matching rule a team has to write and keep current as the system changes.
Extensibility
Every platform eventually hits a fault type it doesn't cover out of the box. What happens next, and how much proof is required before it's trusted, is a real differentiator.
How Grafana Cloud handles it
Sift remains a fixed, curated library of checks that Grafana builds and maintains. Real extensibility now lives in the Assistant layer: teams can build Skills and Watcher agents for situations Sift doesn't cover, and auto-approve specific tools (such as opening GitHub pull requests or sending Slack messages) inside a remediation flow. The trust model is still the same one described above: a team writes and tests the automation itself, then confirms it before it runs unattended.
How DataAgent handles it
DataAgent's fault-class catalog extends through WEAVE (declarative fault-class definitions) plus K8sGPT-style analyzers. Every class earns its way into production the same way: inject the fault in a sandbox, confirm detection, confirm recovery, then, once the customer enables it, let it run autonomously against the Fault Ladder's trust thresholds. That's slower to add than a new dashboard panel or a hand-tested watcher, and it's also why a verified fix ships instead of a plausible-looking one.
Fault Coverage, Side by Side
Depth key: ● full loop (detect, diagnose, act, verify) · ◑ detect + root cause, no action · ○ detects or investigates only · n/a not covered
| Fault class | DataAgent | Grafana (Sift / Asserts) |
|---|---|---|
| CrashLoopBackOff (bad image, broken probe, init container) | ● | ○ Kube crash detection |
| OOMKill / resource exhaustion | ● | ○ Kube crashes + noisy-neighbor detection |
| Golden-signal degradation (error rate, p99, saturation) | ● | ○ error-pattern detection, Grafana's strongest area |
| Stuck rollout (PodDisruptionBudget-blocked) | ● | ○ correlation only, no PDB-specific diagnosis |
| NetworkPolicy-caused connectivity failure | ● | ○ symptom (5xx) only, no policy root cause |
| Config drift (ConfigMap change, audit-attributed) | ● | n/a |
| RBAC denial (403 in the K8s audit log) | ● | n/a |
| External service failure (RDS unreachable, unhealthy ELB) | ● | ○ symptom only, no cause, no action |
| IAM permission drift (S3/Secrets Manager deny, SG revoke) | ● | n/a, Sift has no CloudTrail/IAM/audit reasoning |
| Certificate expiry | ◑ | ○ blackbox metric alert at best |
This table reflects Sift and Asserts' built-in catalog specifically. Assistant Investigations and Watcher agents can extend action to additional scenarios a team builds and tests, but they're not a pre-built, class-by-class catalog comparable to the rows above, so we've left them out rather than guess. This is a representative sample either way, not the full picture on either side. A fuller fault-by-fault walkthrough is something our team is happy to run against your actual cluster in a demo.
Cross-Stack Reach
Most teams don't run a single-vendor stack, so it matters whether a platform's RCA can actually see everything, or only what's already inside its own walls.
How Grafana Cloud handles it
Grafana's visualization, alerting, and Assistant are genuinely source-agnostic across hundreds of data source plugins. Sift's automated RCA is narrower: its analyses run primarily on Prometheus and Loki data, so getting Sift's RCA to see Datadog data means forwarding it into Grafana Cloud first, a re-load into Grafana's own stack rather than a read-in-place connection.
How DataAgent handles it
DataAgent doesn't ask other tools to forward data anywhere first. Its cloud-control-plane reasoning (CloudTrail, IAM, audit logs) is native, not routed through a metrics proxy, regardless of which vendor's telemetry sits next to it.
If You're Already Running Grafana Cloud
You don't have to rip it out to get any of this. DataAgent is built AWS-native and doesn't require a third-party observability layer to function, but it also doesn't require you to remove one. Point it at your existing Grafana stack (Mimir, Loki, Tempo, Pyroscope) as a read-only signal source, let Sift and Assistant keep doing what they're genuinely good at, and let DataAgent carry the fault classes that need cloud-control-plane reasoning and a verified fix through to resolution. No rip-and-replace, no vendor lock-in, and Grafana's existing dashboards keep working for the team members who still want them. Start with a read-only deployment: it produces a fault-coverage report and a cost-savings analysis before DataAgent is given permission to act.
Who This Matters Most For
Mid-market SRE and platform teams (roughly 16 to 50 engineers) feel this gap first: enough incident volume that manual log correlation and alert triage are a real tax on the team, and enough deploy velocity that tracing an incident back to the specific change is where the hours actually go. This is the segment where closing the loop, not just finding the symptom or grouping the alerts faster, moves MTTR the most.
Larger, lower-enterprise platform orgs (50-plus engineers) feel it differently: Grafana's per-gigabyte, per-series cost model compounds at scale, and procurement or security review wants auditable, gated automation rather than a black box. The Fault Ladder's earned-autonomy model, nothing acts until it's proven itself against an injected, answer-keyed fault, is built for exactly that review.
High deploy-velocity teams of any size run into a version of this even with a small headcount: at ten-plus deploys a day, tracing an incident to the specific change that caused it is close to impossible to do by hand, no matter how good the dashboard is, and hand-testing a Watcher agent for every new failure mode doesn't scale at that pace.
Where It Lands
Grafana Cloud is the right choice for the open, multi-source sensor layer, for symptom-level investigation at scale, and, increasingly, for teams that want to build and hand-test their own automations through Assistant Investigations and Watcher agents. Adaptive Telemetry is a legitimate way to cut a bloated bill. What still sets DataAgent apart isn't whether either platform can act, it's how that trust gets earned and how far each one can see: DataAgent, an autonomous SRE platform, proves each fault class against an injected, answer-keyed failure before it's trusted broadly, rather than requiring a team to hand-test each automation one at a time, and it reasons over the AWS and Kubernetes control planes, CloudTrail, IAM, the K8s audit log, that Grafana's tools still don't reach.
Don't just observe. Remediate.
Sources (verified October 2026)
- Grafana Labs: Adaptive Profiles GA, completing the Adaptive Telemetry suite (Aug 4, 2026)
- Grafana Cloud Adaptive Metrics documentation
- Sift analyses overview · Sift: Kubernetes crashes · Sift: error-pattern logs
- Introducing Assistant Watchers: agentic alerting for Grafana Cloud (July 29, 2026)
- Grafana data sources · Sending Datadog metrics into Grafana Cloud
- Grafana Labs Ships Six Tools That Power Agentic Operations From Planning to Production (press release, July 27, 2026)
- Automatically discover and remediate root causes with Grafana Assistant Investigations
- Assistant Automations is generally available in Grafana Cloud
- Introduction to Grafana Assistant (FAQ)
- Grafana Labs launches six AI tools for telemetry & agents (Watcher agents in public preview)
This comparison is based on Grafana's publicly documented product capabilities and pricing model as of the dates above. Product capabilities change, especially right now, if something here is out of date, we'd genuinely like to know, flag it to the DataAgent team.
- #Grafana
- #Comparison
- #Autonomous SRE
- #Remediation
- #Observability
See remediation-first in your own stack
Install an agent and watch DataAgent map your topology. No credentials, no commitment.
Keep reading
 Engineering7 min
What You Won’t Hear at ObservabilityCON
The stage shows an AI agent on top of your data cloud. The people who carry the pager, when no vendor is in the room, describe something else: an agent that goes to the data, a backend that becomes storage, and a bill that stops charging for a reader who has left.
Nati Shalom • Oct 15, 2026 Engineering14 min
Who Pays for the Dashboard?
We priced one Kubernetes-on-AWS workload across observability backends. Copying telemetry into a SaaS platform costs 5–9× the open-source floor, and an autonomous agent uses none of what the premium buys. Build the substrate cheap; fund the loop.
Nati Shalom • Oct 11, 2026 Engineering11 min
Is AI Making Your SRE Team Better? Ask the Scale, Not the Mirror
AI makes engineers faster at producing changes and makes production less stable. Which effect wins depends on your platform. Four production numbers tell you whether AI is actually making your SRE team better.
Shahar Harap • Oct 11, 2026