Who Pays for the Dashboard?
We priced one Kubernetes-on-AWS workload across observability backends. Copying telemetry into a SaaS platform costs 5–9× the open-source floor, and an autonomous agent uses none of what the premium buys. Build the substrate cheap; fund the loop.
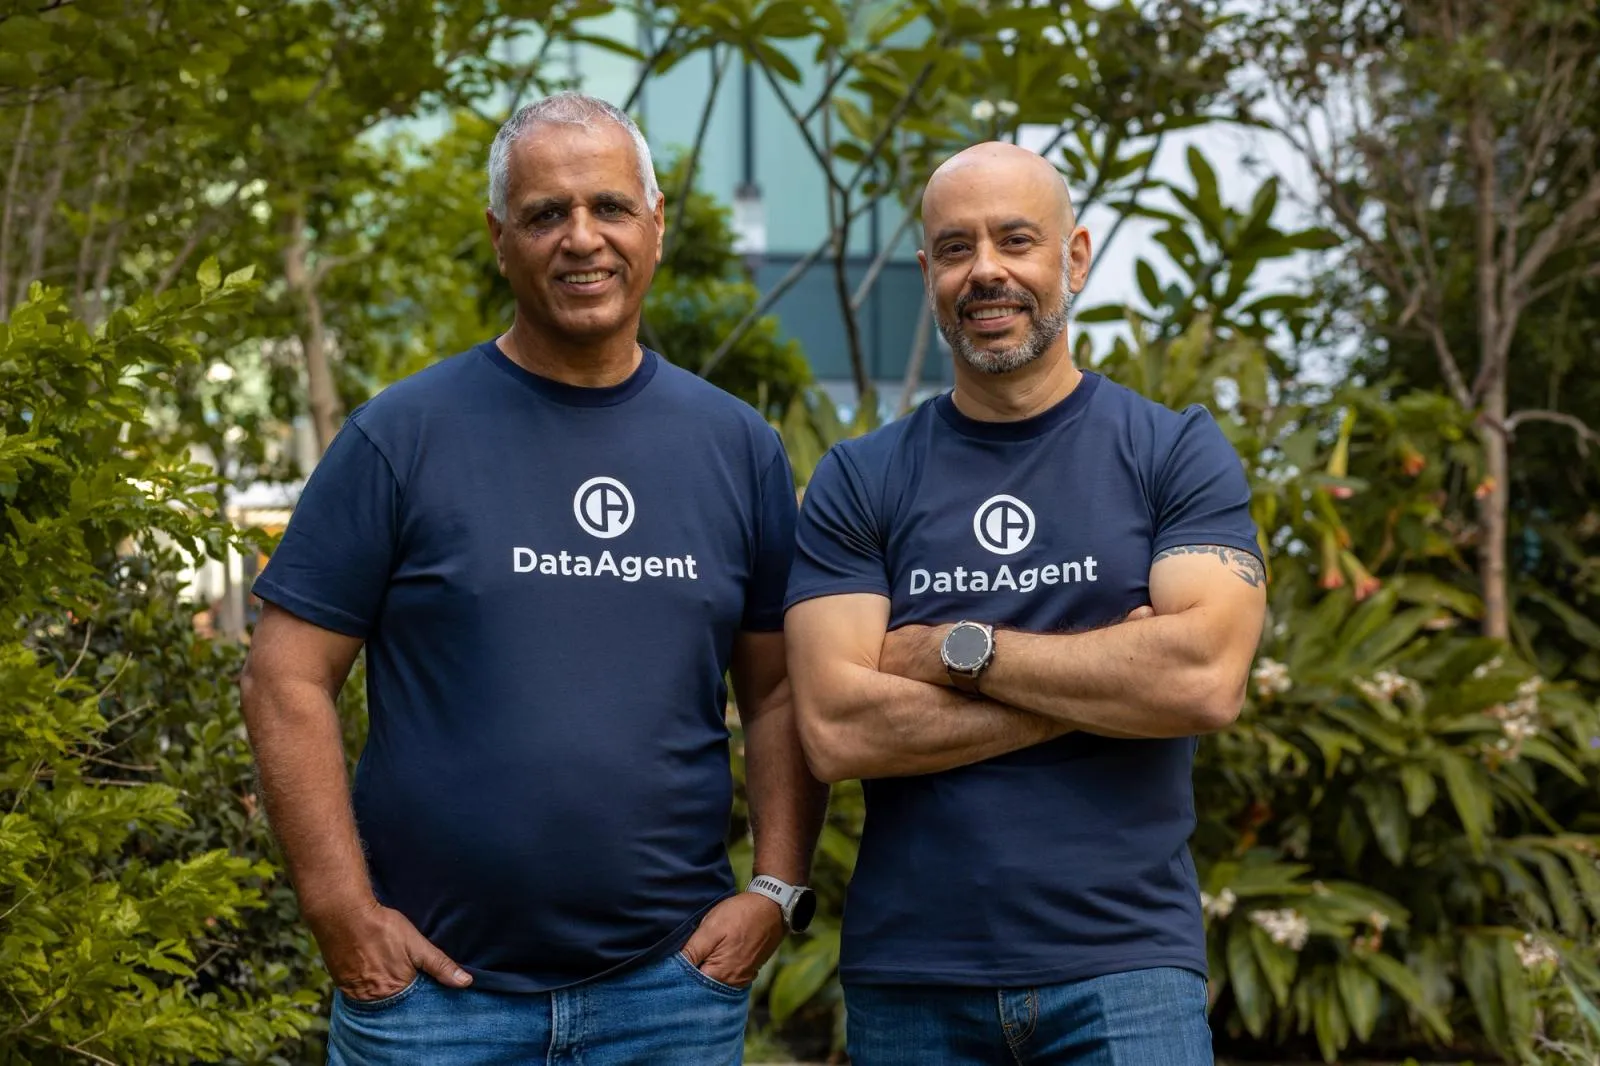 Nati ShalomCo-founder & CTO
TL;DR
- We priced one common Kubernetes-on-AWS workload across observability backends, normalized to a 60-second scrape. Commercial SaaS platforms that copy telemetry into their own cloud cost 5–9× the self-hosted open-source floor; read-in-place Grafana + Prometheus costs roughly 1–1.2×.
- Most of the gap is architectural. Managed AWS services publish telemetry to CloudWatch unconditionally, so a SaaS platform has to buy a second, paid copy of it. Reading it in place skips the double bill.
- The premium pays for the pane: dashboards, per-seat editors and UX polish. An autonomous agent uses none of it.
- Cost is only half the story. Metrics, logs and traces show the symptom; the cause usually lives in configuration, drift, permissions and topology, which an agent reads from the Kubernetes and cloud control planes.
- Build the signal substrate cheap and machine-readable, and put the savings into the layer that acts.
I have argued before that autonomy doesn't remove sensing: a self-driving car has more sensors than the car you drive, not fewer. What autonomy removes is the audience. The dashboard was always for a human. When the system acts on its own, observability stops being a destination you pay to look at and becomes a substrate the agent reads and acts on. The slogan was: don't port the data, port the action.
This post follows the money. If observability is becoming the substrate for an autonomous SRE, the obvious question is: where should that substrate live and what does it cost to build on? The short answer fits in a social post. This is the long one: how we measured it, what the numbers actually say, and the blind spot that cost alone misses.
The instinct, and the trap
Most teams already pay for Datadog, Dynatrace, or New Relic. So when they build or buy an AI SRE, they point it at the same backend. It feels efficient: the data's already there, indexed, correlated.
Here's the trap. The commercial observability bill is mostly the price of the pane. The polished UI, the curated dashboards, the per-seat editors, the alerting workflows, the years of UX polish. That's the premium you're paying for. And it is exactly the part an autonomous agent never touches. An agent doesn't open a dashboard. It runs queries, correlates signals, and acts.
So you end up paying the dashboard tax to feed a system that has no eyes.
To be clear, this isn't a call to rip out the stack your humans still use. That stack can be re-fitted, one fault class at a time. The question here is narrower: the substrate the agent reads. Where should it live, and what should it cost?
How we measured it: a common Kubernetes stack
To compare honestly, we modeled a stack most teams will recognize: a handful of EKS clusters running a few thousand pods, with the usual managed AWS dependencies behind them: RDS, ALB, SQS, S3. We hold the workload identical across every backend: the same number of active series (unique metric streams), the same log volume, the same trace volume, the same 60-second scrape. Only the observability substrate changes. Apples-to-apples.
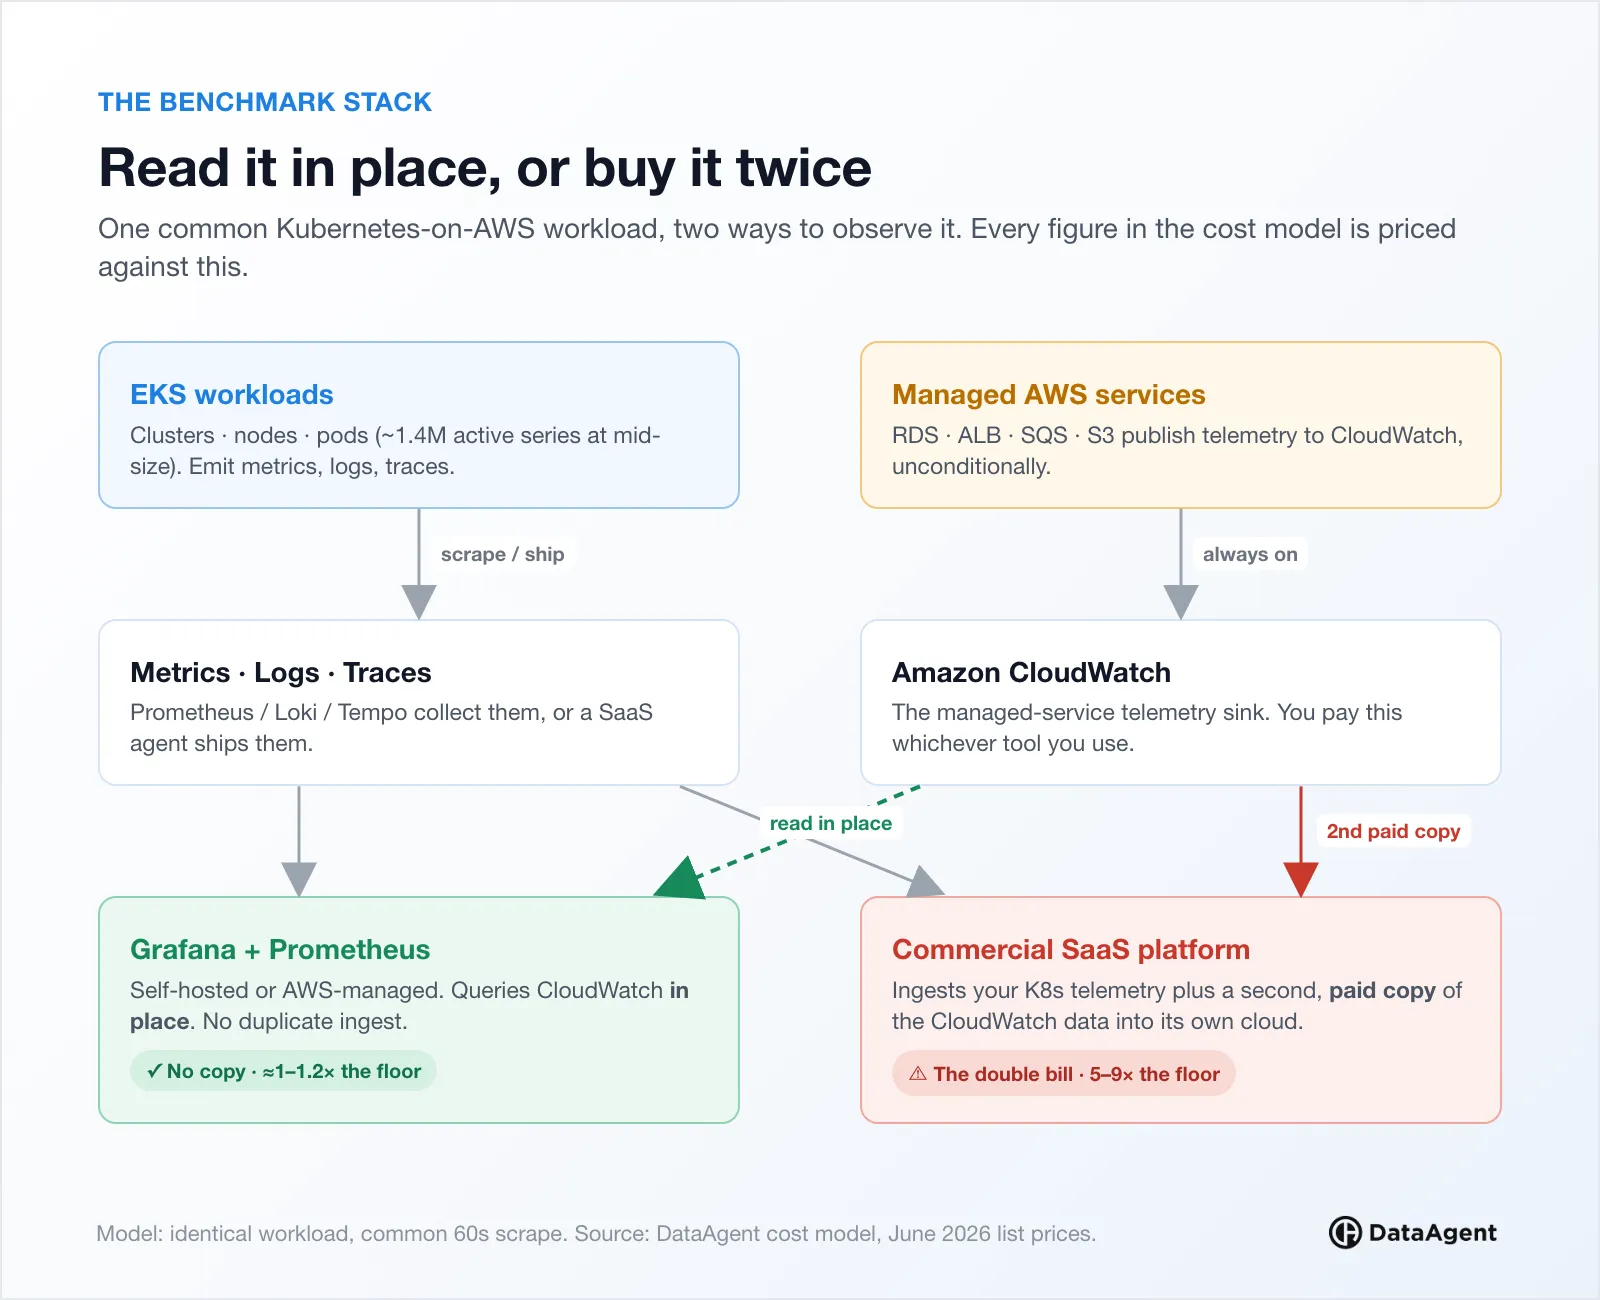
One feature of that stack drives most of the cost difference, and it's worth stating plainly:
The managed infrastructure is already observed by the cloud. RDS, ALB, SQS and friends publish their metrics and logs to CloudWatch, unconditionally. You can't point them at Datadog. So any solution covering a real Kubernetes-on-AWS stack must integrate with CloudWatch. That part isn't optional.
The only question is how it integrates:
- Read it in place (federated). A Grafana/Prometheus stack queries CloudWatch directly via its data source. No copy, no second bill.
- Copy it in (ingest). A SaaS platform streams a second, paid copy of that same telemetry into its own cloud on top of the CloudWatch charge you're already paying. That's the "single-pane" double bill.
That single architectural choice (read-in-place vs. copy) is a large share of the gap below.
What "normalized" means and why we chose it
You can't compare these tools at their list prices, because they don't bill on the same thing. Datadog bills per host plus per custom metric (cardinality); Grafana Cloud bills per active series; Elastic bills on resources; CloudWatch bills tiered per metric. They also collect differently out of the box. A Prometheus/Grafana stack commonly scrapes every 15 seconds. A cardinality-billed tool charges the same no matter how often you sample. Compare them as configured and the same workload can look 4× bigger on one tool purely because of a default scrape interval. That's apples-to-oranges.
So we normalize. Every backend is priced against the identical workload (same active-series count, same log GB, same trace volume) at a single common 60-second scrape. We picked 60s deliberately: it's the Prometheus/Alloy upstream default and Grafana Cloud's included resolution, the neutral baseline nobody can call rigged. What's left in the chart is the thing we actually want to compare: the vendors' pricing models, not their default knobs.
Putting a number on the observability tax
Measured against the self-hosted OSS floor (Prometheus + Loki + Tempo + Grafana, run by you):
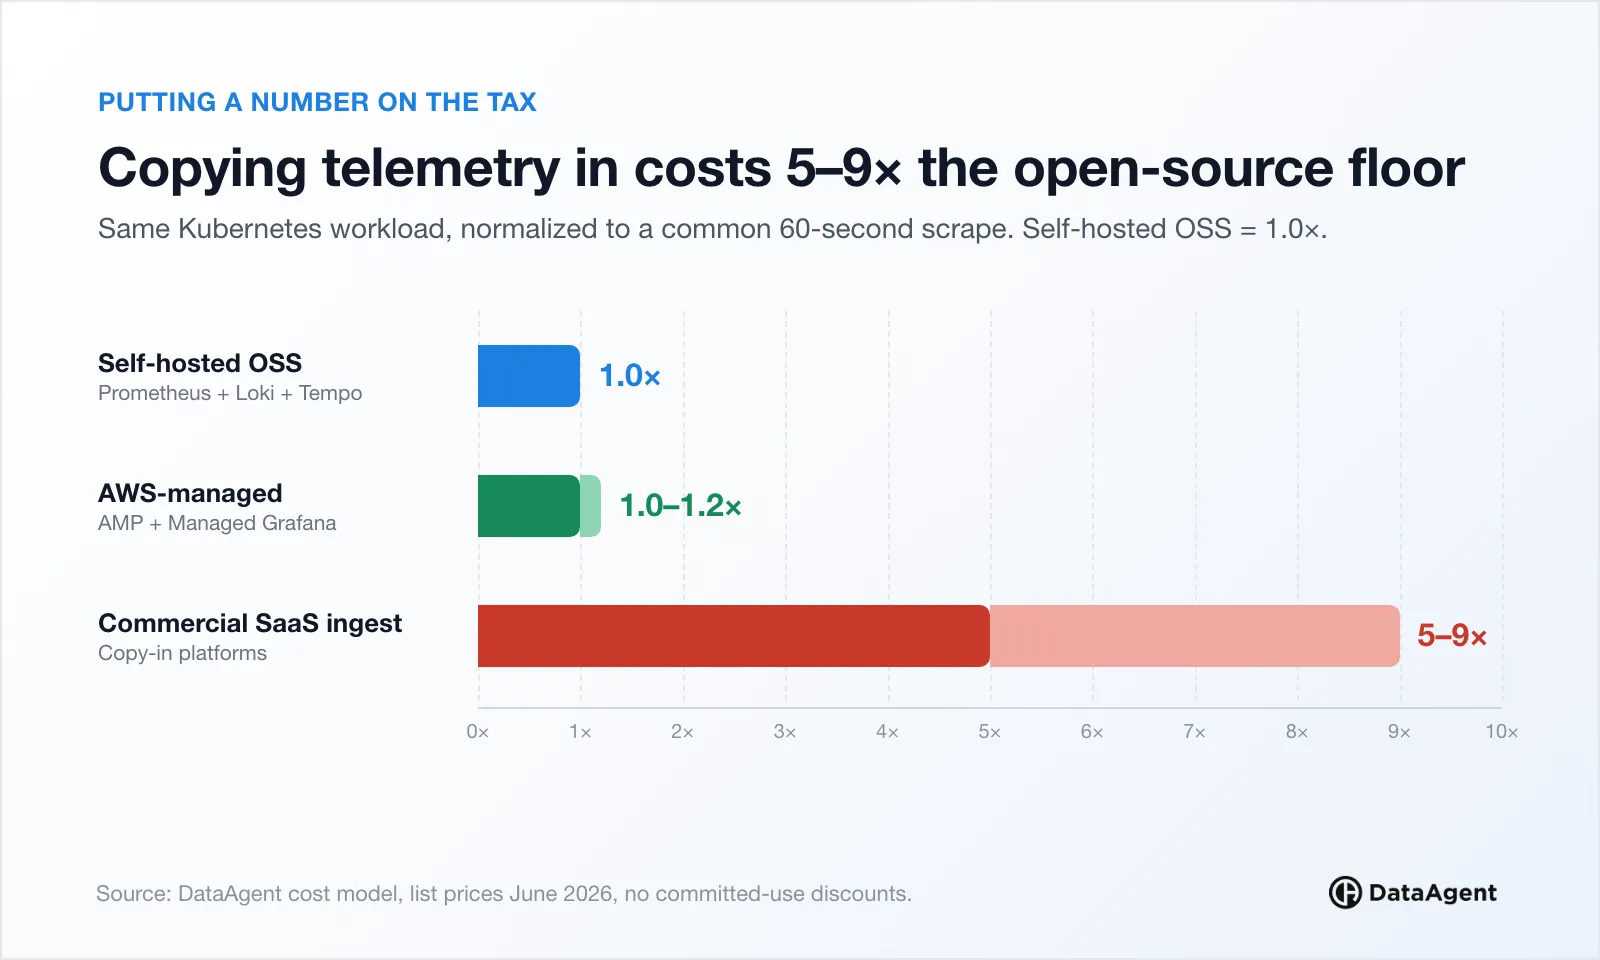
Read it with the autonomy lens. You're being asked to pay 5–9× the floor for what? Dashboards no agent opens. Per-seat editor licenses for a robot. Polish on a pane nobody's looking at. For a human-operated shop the premium can be worth it: managed ops, support, a UI your engineers love. For an autonomous agent, almost none of that has a customer.
One commercial vendor is worth naming precisely because it breaks the pattern, and then, instructively, doesn't. groundcover prices by Kubernetes node ($30/host/month, Pro) and keeps your telemetry in your own cloud rather than copying it into theirs, so both the volume ramp and the copy double bill disappear. That's the right instinct, and proof the bill was never a law of physics. But look closer and the lake reappears: that $30/host is the license for the agent and control plane; the logs, metrics and traces still have to be stored and served somewhere, and that somewhere is your cloud (object storage, a time-series database, compute, all sized to your retention). The license is flat; the data infrastructure underneath is not. Which is the point from another angle: whoever holds the lake pays for it. The cost lives with the data, and the data is exactly what an autonomous agent needs least.
Why Grafana + Prometheus is the right substrate for an autonomous SRE
For an autonomous SRE, the cheap substrate isn't a compromise you tolerate. It's the correct choice. An agent needs three things from its sensing layer:
- Complete signals: metrics, logs, traces, events. Prometheus + Loki + Tempo + CloudWatch cover the same signals the SaaS tools collect; often they're the very source those tools ingest from.
- A queryable, machine-first interface: PromQL, LogQL, the CloudWatch API. Open, scriptable, agent-friendly. No screen-scraping a vendor UI.
- Read-in-place: query the data where it already lives instead of paying to copy it into someone else's cloud.
Self-managed Prometheus/Grafana (or Amazon Managed Prometheus + Amazon Managed Grafana if you'd rather not run it) give you all three at roughly 1–1.2× the floor. The agent reads PromQL; Grafana still renders a dashboard for the rare human who wants to look. The expensive thing in commercial observability, the human-facing experience, is the thing autonomy makes redundant. Removing it isn't losing a feature; it's removing a cost that no longer has anyone to serve.
And this is only the price lever. There is a volume lever too: fault-driven fidelity instead of buying data no one reads. The two savings compound.
But cost is only half the story: the blind spot
Here's the catch that applies to all of them, SaaS and OSS alike: metrics, logs and traces tell you a symptom is happening. They rarely tell you why. And in Kubernetes the "why" usually lives in state and change that no dashboard watches:
- A ConfigMap or Secret that changed five minutes before the errors started.
- A Deployment that drifted from its desired state: replicas scaled to zero, an image tag rolled, a resource limit edited by hand.
- An IAM role or RBAC permission that was revoked.
- The topology: which service talks to which, which pod depends on which RDS instance, which namespaces share an ALB or a VPC endpoint: the dependency graph that turns a symptom into a root cause.
Observability tools were built to render time-series for a human to interpret. They stop at the symptom because a human was always expected to take it from there. They are largely blind to desired state, configuration drift, and topology: the exact context an autonomous agent needs to diagnose and act, not just display.
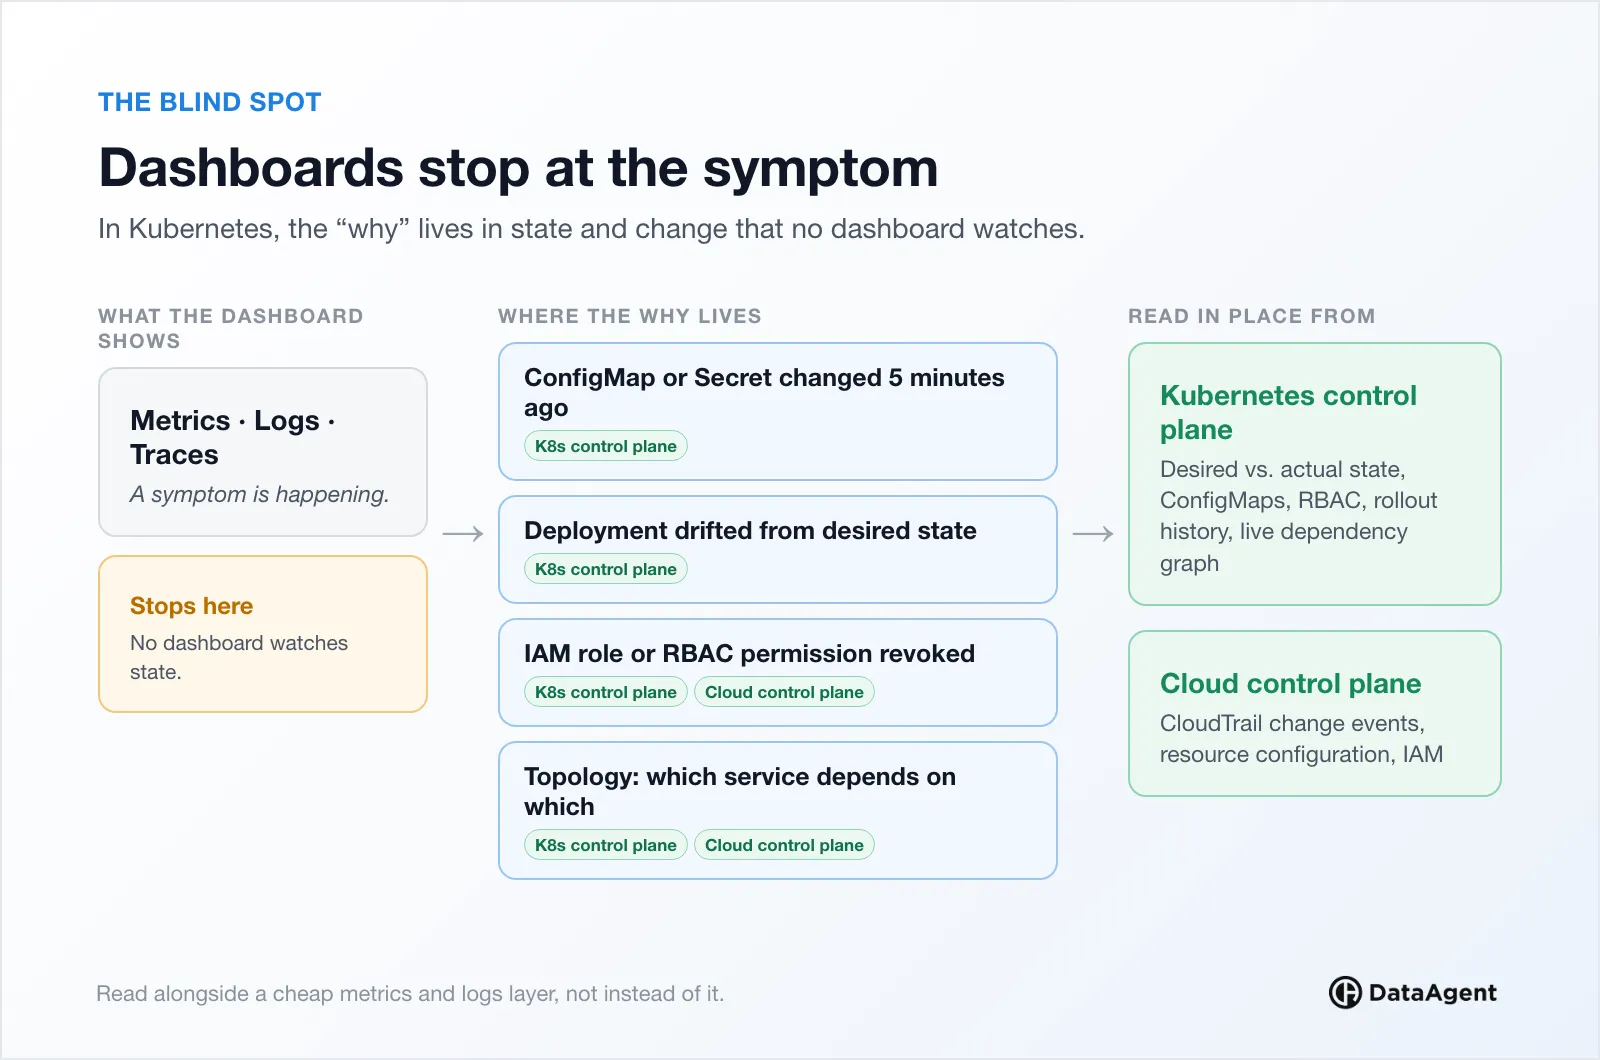
And those answers don't live in a metrics backend at all. They live in the two control planes the system already runs: the Kubernetes control plane (desired vs. actual state, ConfigMaps, RBAC, rollout history, the live dependency graph) and the cloud control plane (CloudTrail change events, resource configuration, IAM). An AI-native substrate reads those in place alongside the cheap metrics/logs layer. That's a different shape of "observability" than a dashboard product was ever built to be. If that sounds familiar, it should: these are the same two native planes Who Is the Dashboard For? argued already see nearly everything that matters at the infrastructure layer.
Why AI-native drives a different approach
Step back and it's the same pattern this post opened with.
A dashboard-era tool optimizes for a human reading a pane: pretty time-series, fast queries, polished UX. And it stops at the symptom, because a human takes it from there. You pay a 5–9× premium for that experience, and an autonomous agent uses none of it.
An AI-native approach optimizes for an agent that has to act. That inverts two things:
- The signal layer should be the cheapest reliable substrate: read-in-place Prometheus/Grafana + CloudWatch, not a 5–9× SaaS copy. The pane has no audience; stop paying its admission.
- It must carry what dashboards never did: live configuration, topology, drift, desired state, change events from the control planes. The agent has to find root cause and remediate, not render a chart.
There is a name for this pattern in AI engineering: the harness. The model is the brain. The harness is the body around it: the tools it can run, the facts it is given, the checks on what it does. Coding agents proved the pattern first, and the lesson is now an industry trend. The top models score about the same (on Kubernetes root-cause work, IBM's ITBench puts every frontier model below 50%, clustered together), so the agents that win are the ones with the best harness around the model. An autonomous SRE is no different. The substrate this post prices is the sensing half of that harness. Build it cheap and machine-readable, and every new model generation makes your agent better for free. The pane premium buys none of that.
The dashboard era spent its budget on the destination: the pane you stare at during an incident. The autonomy era should spend it on understanding state and closing the loop: the thing that finds the cause and fixes it while you sleep.
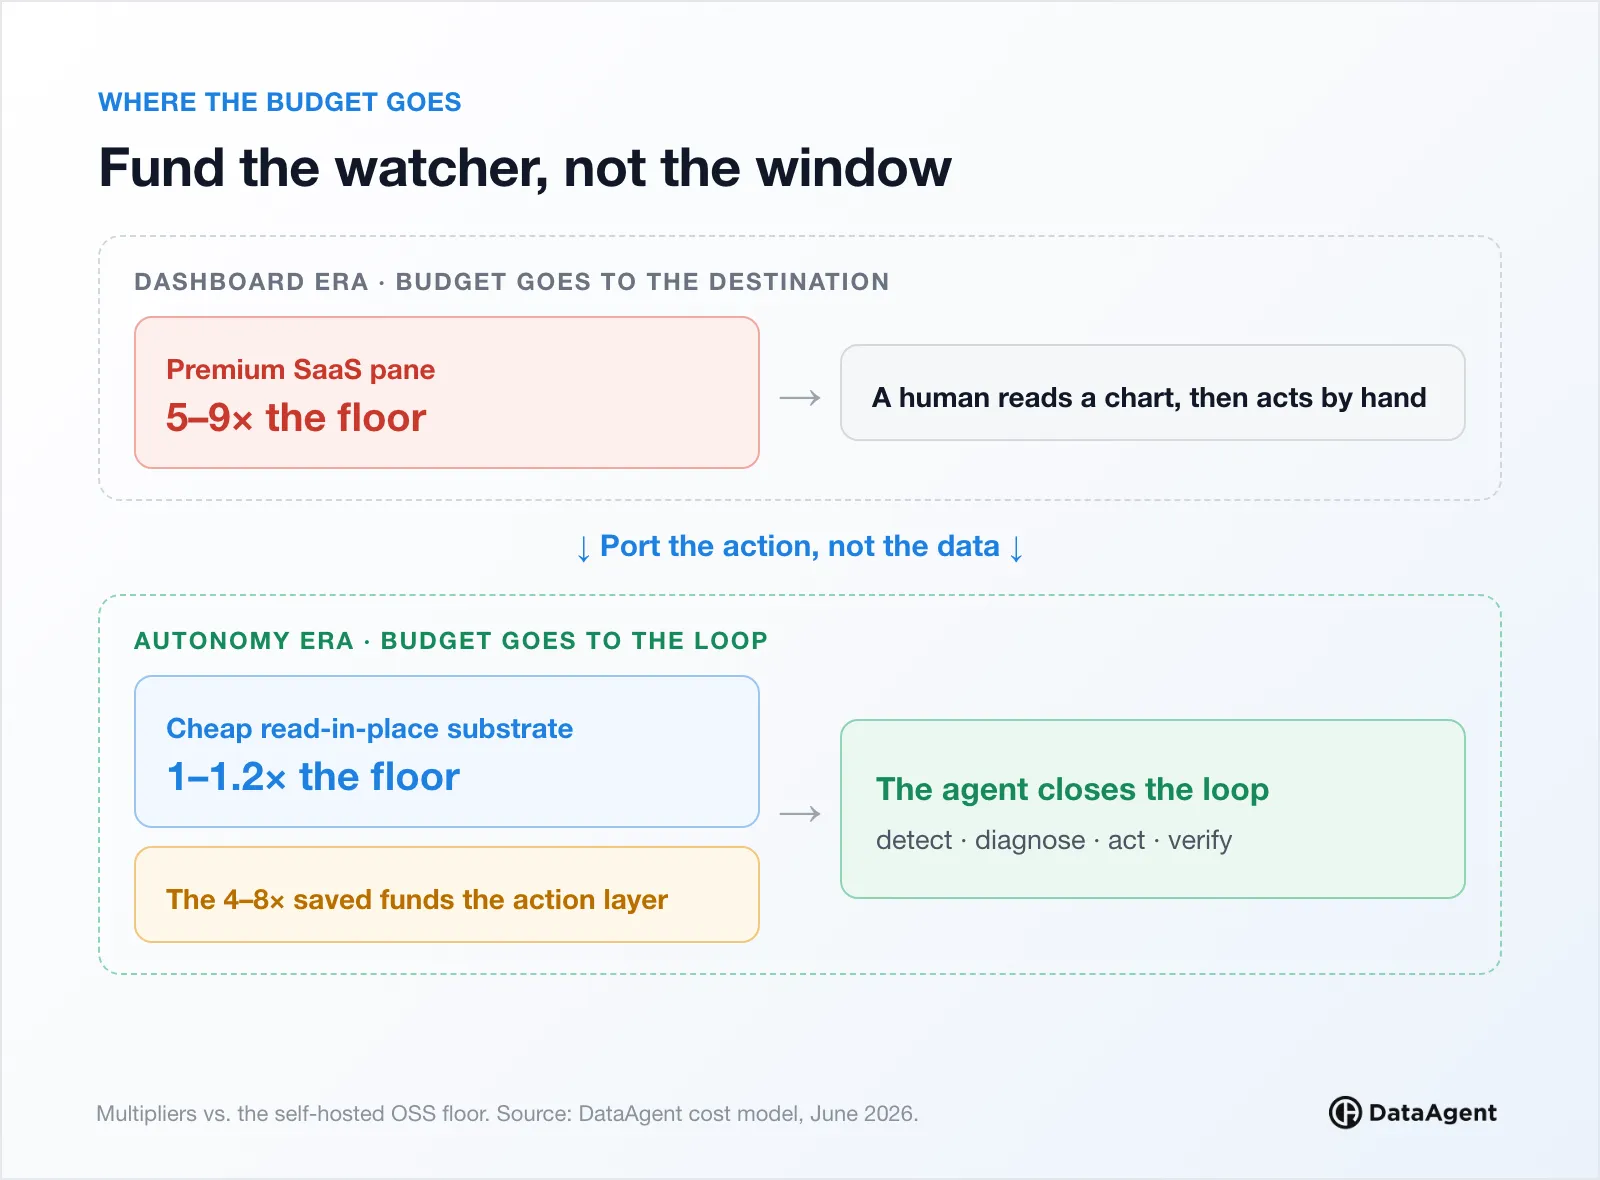
Don't port the data. Don't pay for the pane. Build the signal substrate cheap and keep it where the data already lives. Then put the savings into the layer that understands the system intimately enough to act on it.
The dashboard was for a human who is leaving the room. Who it was for in the first place is Part 1 of this series; how every number here was measured is Part 3. The lesson of this part stands on its own: fund the watcher, not the window.
Convinced the substrate should be cheap and the budget should fund the loop, but wondering how you would actually build one? That is exactly why I started a free, open-source training series on how to build your own autonomous SRE: the detect, diagnose, act, verify loop, wired to your own Kubernetes and cloud planes, built up step by step. This post is the why; the series is the how. Start here: How to build your own autonomous SRE (free, open-source training series).
FAQ
Why does commercial observability cost so much more than open source for the same workload?
In our model, most of the gap comes from two things: paying for a human-facing product (dashboards, per-seat editors, alerting workflows) and paying to copy telemetry into the vendor's cloud. On AWS, managed services already publish to CloudWatch, so an ingest-based platform charges again for a second copy of data you've already paid for once.
What is the CloudWatch double bill?
RDS, ALB, SQS and other managed AWS services send their metrics and logs to CloudWatch whether you want them to or not. A tool that reads CloudWatch in place adds only small API charges. A tool that ingests it adds Metric Streams, log forwarding and its own ingest fees on top of the CloudWatch bill.
Do I have to replace my current observability vendor?
No. The stack your engineers use can stay, and be re-fitted one fault class at a time. The question is narrower: what the autonomous agent reads. That substrate can be cheap, open and read in place, alongside whatever your humans look at.
Is Amazon Managed Prometheus and Managed Grafana a good option if I don't want to run Prometheus myself?
Yes. In our model, AWS-managed Prometheus and Grafana land at roughly 1–1.2× the self-hosted floor while giving the agent the same PromQL interface and in-place CloudWatch access.
What does an autonomous SRE need beyond metrics, logs and traces?
State and change: configuration and secrets, desired versus actual state, rollout history, IAM and RBAC, and the live dependency graph. Those live in the Kubernetes and cloud control planes, not in a metrics backend, and they are what turns a symptom into a root cause.
Appendix: cost model details
Every number in this post comes from one open model: list prices (June 2026, no committed-use discounts), applied to the same normalized workload at a 60-second scrape (1 data point per minute).
Vendors modeled: self-hosted OSS, AWS-managed (Grafana + AMP), Grafana Cloud, Elastic, Dynatrace / New Relic, Datadog, plus groundcover (node-based: $30/host license + your-cloud data infrastructure for storage and retention).
Workload sizing
The primary driver of the cost model is the active series count. Unlike byte-based billing, metrics vendors charge based on the number of unique time-series streams (combinations of metric names and labels).
- Active series definition: each unique label set creates a separate stream to ingest, store, and index. For example, changing a single label like pod or route creates a new series.
- Estimation formula: we use the heuristic (nodes × 1,500) + (pods × 200) + app custom metrics. This accounts for infrastructure series per node and container-level metrics from cAdvisor and kube-state-metrics.
- Pod dominance: pod-level metrics typically account for ~75% of total volume. High-cardinality labels (like pod hashes) are the primary cause of ballooning observability bills.
This normalized workload ensures the price gaps reflect differences in vendor pricing models rather than varying architectural assumptions.
| Tool | Pricing model |
|---|---|
| AMP (Amazon Managed Prometheus) | $0.09 per 1M samples (first 2B), then $0.035 |
| CloudWatch Metrics | Tiered: $0.30 (first 10k) → $0.10 → $0.05 → $0.02 |
| Datadog | $15/host + $8.00 per 1k custom series [VERIFY: Datadog docs list custom metrics overage at $0.10 per 100; no source found for $8/1k] |
| Dynatrace / New Relic | $7.50 per 1k active series [VERIFY: neither vendor bills per active series — Dynatrace bills per datapoint, New Relic per GB ingested plus users] |
| Grafana Cloud | $6.50 per 1k series (scaled by DPM) |
| Self-hosted OSS | (series/1k × $0.80 × DPM) + (nodes × $2 infra) |
| Category / tool | Pricing model |
|---|---|
| CloudWatch Logs | $0.50/GB ingest + $0.03/GB storage + Insights scans |
| Datadog Logs | $0.10/GB ingest + ~$1.70 per 1M events indexed |
| Loki (self-hosted) | Compute + S3 storage (highly compressed) |
| AWS X-Ray | $5.00 per 1M traces (after first 100k free) |
| Audit (CloudTrail/Config) | $20 base + $0.05/pod + $0.01/log GB |
AWS-service telemetry: the double bill
Managed dependencies like RDS, ALB, and SQS publish their metrics and logs to CloudWatch unconditionally. You pay that fee regardless. Because a SaaS platform cannot read these natively, it streams a second, paid copy into its own cloud, adding Metric Streams and ingest fees on top of your existing bill. In contrast, a Grafana/Prometheus stack federates the data, reading it in place to skip the duplicate charge. Every tool must integrate with CloudWatch; the only variable is whether you read the telemetry or re-buy it: an architectural choice that drives the lion's share of the cost gap.
| Strategy | Cost impact |
|---|---|
| Federated (OSS/Grafana) | Read-in-place: small API call charges only |
| Ingest (SaaS copy) | Double bill: Metric Streams + log forwarding + ingest fees |
References
List prices change; these are the canonical sources the model is calibrated against (verified June 2026).
AWS (list pricing)
- Amazon CloudWatch pricing: custom metrics (tiered), logs ingest/store/scan, Metric Streams
- Amazon Managed Service for Prometheus pricing: per-sample ingestion
- Amazon OpenSearch Service pricing
- AWS CloudTrail pricing · Amazon S3 pricing
Commercial platforms (list pricing)
- Datadog pricing, custom metrics billing, and log management pricing (vendor pricing pages)
- Grafana Cloud pricing, metrics usage and cost, and active series and DPM (vendor pricing and docs pages)
- Dynatrace pricing (vendor pricing page)
- New Relic pricing (vendor pricing page)
- Elastic Cloud pricing (vendor pricing page)
- groundcover pricing and cost optimization (vendor pages)
Open-source substrate
Sizing and prior work
- CNCF Annual Survey 2023: cluster / node / pod distribution used for the size presets
- ITBench (IBM Research): frontier-model scores on Kubernetes root-cause analysis, cited in the harness paragraph
- The Agent Harness for an Autonomous SRE: the architecture argument in full. Coming shortly.
- Who Is the Dashboard For?: Part 1 of this series, coming shortly.
- AI Is Breaking Production, and Observability Can't Fix It: the thesis this series builds on.
- Why You Can't Compare Observability Prices, and How We Did It Anyway: Part 3 of this series, how every number in this post was measured. Coming shortly.
- #Observability Cost
- #Autonomous SRE
- #Kubernetes
- #AWS
- #CloudWatch
- #Prometheus
See remediation-first in your own stack
Install an agent and watch DataAgent map your topology. No credentials, no commitment.
Keep reading
 Engineering7 min
What You Won’t Hear at ObservabilityCON
The stage shows an AI agent on top of your data cloud. The people who carry the pager, when no vendor is in the room, describe something else: an agent that goes to the data, a backend that becomes storage, and a bill that stops charging for a reader who has left.
Nati Shalom • Oct 15, 2026 Engineering11 min
Is AI Making Your SRE Team Better? Ask the Scale, Not the Mirror
AI makes engineers faster at producing changes and makes production less stable. Which effect wins depends on your platform. Four production numbers tell you whether AI is actually making your SRE team better.
Shahar Harap • Oct 11, 2026 Product7 min
They Told Me the Market Is Saturated. That's Exactly Why I Co-Founded DataAgent.
Everyone agrees observability costs are out of control, and almost nobody believes there is a fix. That gap is why I joined DataAgent as co-founder and CTO.
Nati Shalom • Oct 5, 2026