Hands-on Workshop

Build your own autonomous SRE

Collecting logs and generating dashboards is easy. Catching a fault while the dashboard is still green, fast and without a flood of false positives, isn't.

That knowledge lives with the people who run production, so we work it out together, in the open. Start with the free, open-source workshop and see what the agent catches that your dashboards miss.

  • Free, Apache 2.0
  • No account, no agent in your environment
  • Up in 5 to 10 minutes
  • About 3.5 GB of RAM
  • macOS, Linux, WSL2

demo-cluster — bash

$ git clone https://github.com/data-agent-co/autonomous-sre-training.git$ cd autonomous-sre-training/demo-cluster && ./scripts/up.shCreating cluster "demo-cluster" ...✓ Ensuring node image✓ Preparing nodes✓ Starting control-planeInstalling Prometheus, Grafana, K8sGPT operator, k8s-watcher ...✓ demo-cluster ready Grafana → http://localhost:3000/d/demo-cluster-overview$ ./scripts/trigger-oomkill.shWarning OOMKilling pod/payments-api container exceeded memory limit$ kubectl --context kind-demo-cluster -n k8sgpt-system get results
NAME
payments-api
KIND
Pod
BACKEND
localai
AGE
48s

Architecture

What Runs on Your Desktop.

Everything in the repo on one page, each part tagged with its folder.

Watch every detector and every fault
scripts/trigger-*.sh

Break it on purpose

Start with a script, stop with a flag.

  • OOMKill

    payments-api

    The crash everyone sees

  • Slow memory leak

    recommend-svc sidecar

    Running, until it is not

  • ConfigMap change

    one kubectl patch

    No crash, no event

demo-cluster/

Your desktop · kind cluster · Docker

demo-apps

  • payments-apiGo service
  • recommend-svc+ leak-fixture
  • catalog-svchealthy control
  • loadgensteady traffic

metrics, pod status, events, ConfigMaps

monitoring

Prometheus

Scrapes every 5s

Grafana - golden signals

Sees the leak climb

Alertmanager

Fires on the OOMKill in seconds

k8sgpt-system

K8sGPT operator ~30s scans

Silent until the pod crash-loops

k8s-watcher - Go, ConfigMap lane

Catches the ConfigMap change

Results

results.core.k8sgpt.ai

.env.example

Optional. Off by default.

Add an LLM

Explains each Result in plain text

  • OpenAI
  • Groq
  • Ollama
  • LM Studio

Local models: nothing leaves

Add Slack

A webhook you control
slack-relay posts each new Result

One post per fault, not per retry

Without them, Results stay in the cluster. Read them with kubectl.

DataAgent Lab

Detect and diagnose, on your own desktop.

Free, open source, Apache 2.0. No account, no agent in your environment.

DataAgent in production

Verified remediation, then the RCA.

Kubernetes and AWS, next to the tools you already run.

What it prints

Real Output, Not Screenshots of Promises.

This is what lands in your terminal, your Slack channel and your dashboard when you run the scenarios.

kubectl

A Result from the watcher

$ kubectl -n k8sgpt-system get results \ -l k8sgpt-detection-pack.io/component=cm \ -o custom-columns='ERROR:.spec.error[0].text'ERRORConfigMap demo-apps/payments-config modified:0 added, 0 removed, 1 changed

spec.details lists the changed keys with digests of their values, never the values.
Slack

The first post of an OOMKill

slack-relay3:02 AM

DemoContainerOOMKilled

Container payments-api in demo-apps was OOMKilled.

The container went past its memory limit and the kernel killed it; the kubelet restarts it.

Alertmanager posts first, within seconds. K8sGPT's Result follows a minute or two later. Layout simplified.

Grafana

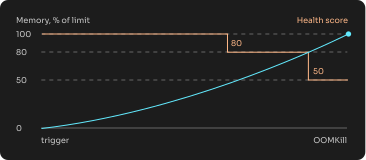
The leak, before the crash

Illustrative chart. Memory climbs from the trigger to the OOMKill while the health score steps down from 100 to 80 and then 50.

Illustration. The Composite Health Score drops 20 points at 50% of the limit and 30 more at 80%, while K8sGPT is still silent.

Watch how it catches slow leaks

Quickstart

From Clone to First Fault in Four Steps

quickstart

git clone https://github.com/data-agent-co/autonomous-sre-training.git
cd autonomous-sre-training/demo-cluster
./scripts/up.sh
./scripts/trigger-oomkill.sh
kubectl --context kind-demo-cluster -n k8sgpt-system get results
open http://localhost:3000/d/demo-cluster-overview

Scripts act only on the cluster named demo-cluster. Creating it switches your kubectl context to it; switch back with kubectl config use-context <name>.

Apache 2.0 · Go and shell · Last updated October 2026

Make it yours. Label your own ConfigMap with k8sgpt-detection-pack.io/critical=true, install charts/k8s-watcher on your dev cluster, or set K8SGPT_LOCAL=true so nothing leaves your desktop.

  1. 01

    Bring it up

    Clone the repo and run ./scripts/up.sh from demo-cluster (or make up from the root). The cluster, apps and dashboards come up in 5 to 10 minutes.

  2. 02

    Break something

    Trigger a fault: ./scripts/trigger-oomkill.sh. Stop it with --stop. The memory leak has its own script; the ConfigMap change is one kubectl command.

  3. 03

    See what was caught

    kubectl --context kind-demo-cluster -n k8sgpt-system get results lists what the operator and the watcher wrote. The payments-api pod shows up within a minute or two.

  4. 04

    Compare with the dashboard

    Open Grafana at localhost:3000/d/demo-cluster-overview and compare the panels against the Results. The gap between the two is the point of the exercise.

Community

Found a Fault the Lab Misses?

Open an issue and say which one. The best ones become the next scenario. This is educational code, provided as-is: the maintainers read every issue but make no support commitment. Contributions are welcome; see MAINTAINERS.md in the repo.