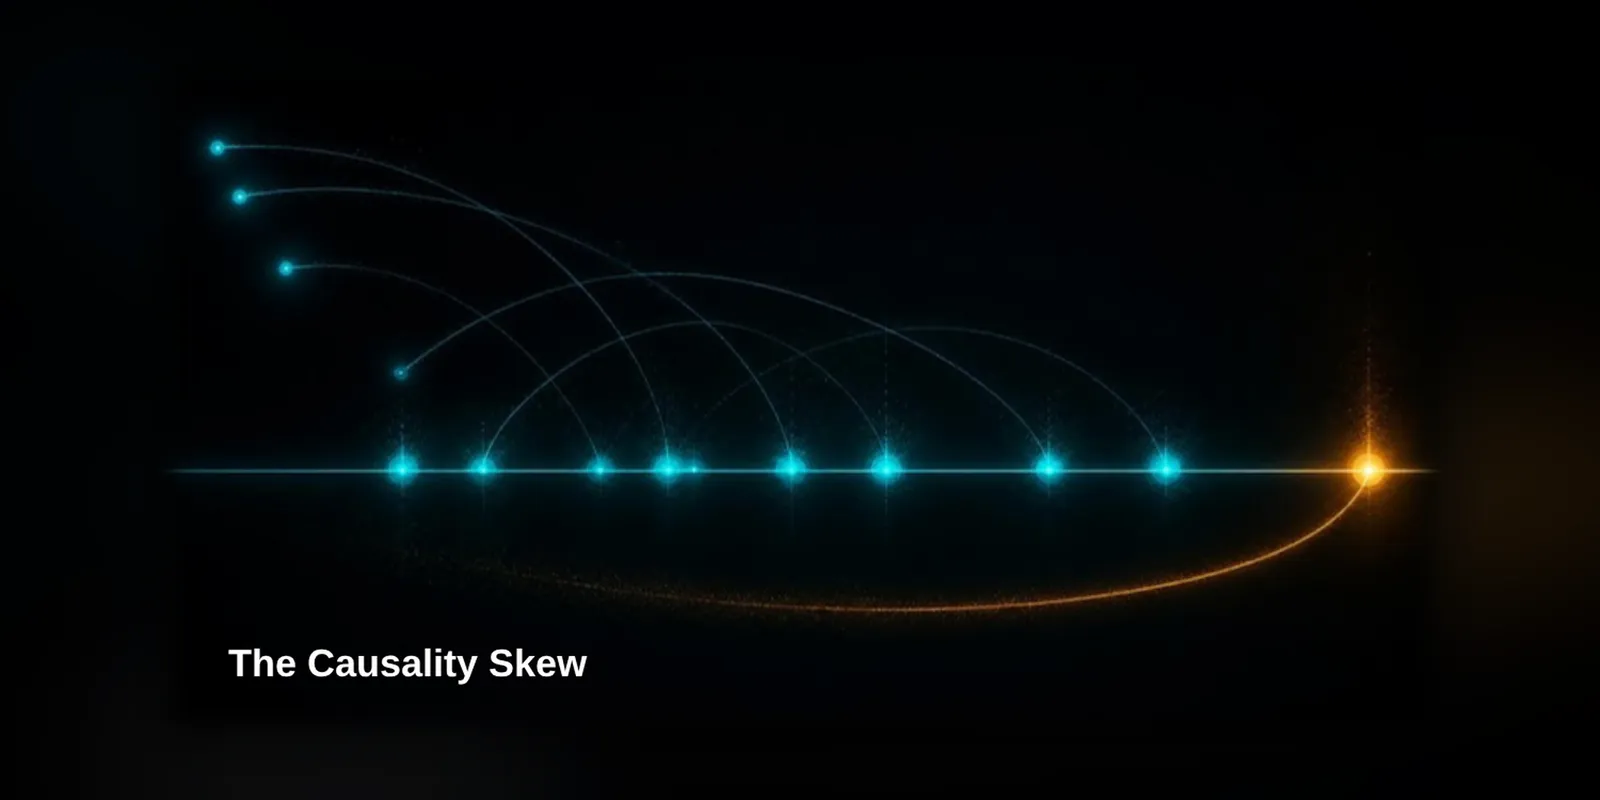
The Causality Skew: Why a Centralized AI Diagnoses Your Incident Out of Order
Metrics land in seconds, cloud audit events in minutes. An AI agent reasoning on a central store sees symptoms before causes and diagnoses your incident out of order. A worked OOMKill example and two fixes: run the agent where data is born, and watermark every source.
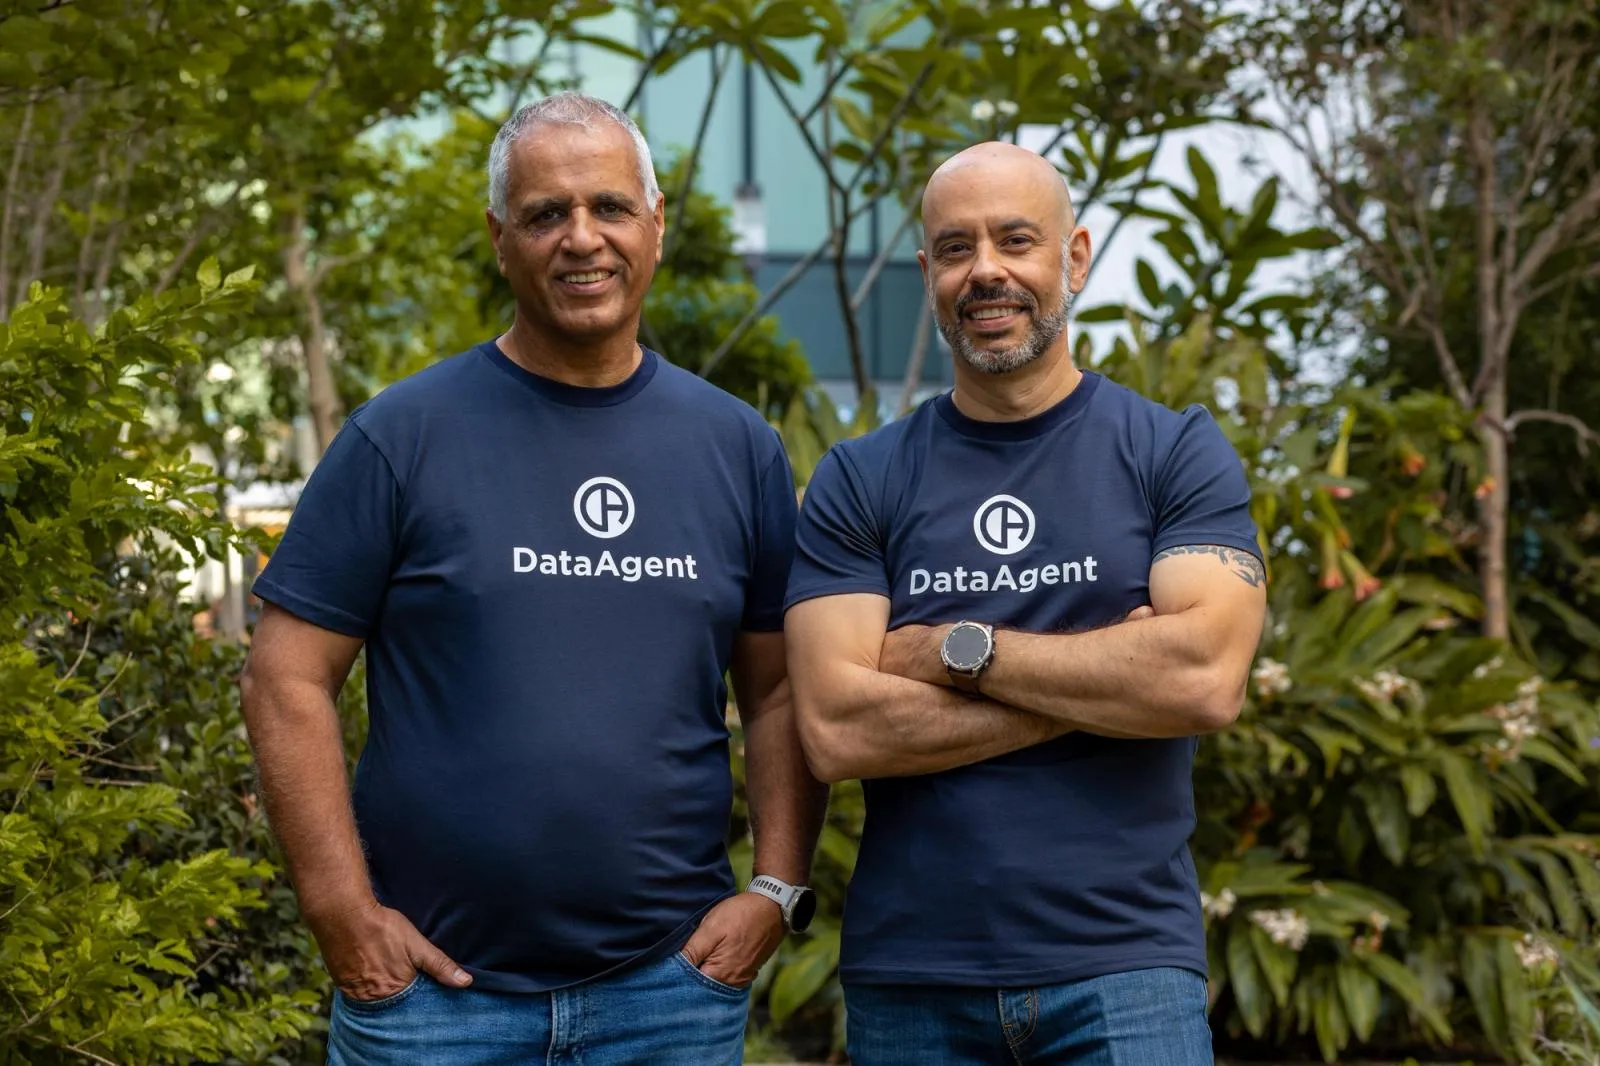 Nati ShalomCo-founder & CTO
TL;DR
Short answer: root cause analysis is only as fast as the slowest evidence it waits for, and the evidence of the cause is usually the slowest. Reading live topology and declared state inside the cluster, the approach DataAgent, an autonomous observability and remediation platform, is designed around, can establish the cause in seconds; a central store has to wait minutes for the same evidence, or gets it wrong.
- Different evidence classes reach a central store at very different speeds. Metrics arrive in seconds; logs in tens of seconds to minutes; cloud audit events take minutes. AWS CloudTrail delivers in about five minutes on average, with no guaranteed delivery time, and its log files are not ordered.
- A human reading a dashboard tolerates this without noticing, because they investigate for twenty minutes and the record settles underneath them while they work.
- An autonomous agent does not have that luxury. It reasons now, on whatever has arrived, and evidence that has not arrived yet is indistinguishable from evidence that does not exist. That is the causality skew.
- The failure mode is specific and nasty: absence of an audit event is silently read as "nothing changed," which is the exact inference that turns a one-query fix into a wrong hypothesis.
- Two mechanisms fix it: run the agent where the data is born, so ordering is governed by one clock and one locality, and watermark every source by its known freshness lag, so the agent knows when its evidence window has not settled and can refuse to attribute a cause, or act on one, until it has.
- The practical rule: never let an agent make a causal attribution, or act on one, on an evidence window younger than the slowest source in that window's lag.
An ordering problem, not a latency problem
Everyone in this industry knows telemetry is delayed. That is not the interesting claim.
The interesting claim is that evidence classes are delayed by different amounts, which means a central store does not just show you a late picture — it shows you a picture assembled in the wrong order.
Rough arrival profiles for the same instant in time, measured from the moment the event actually occurred to the moment it is queryable centrally:
| Evidence class | Typical path | Typical lag to queryable |
|---|---|---|
| Metrics (scraped) | Scrape interval → remote-write → ingest | ~15–60s |
| Metrics (pushed, cloud) | Provider aggregation window → API | ~1–5 min |
| Container logs | Log agent tail → buffer → ship → index | ~10–90s, longer under backpressure |
| Kubernetes events | API server → watch → export | Seconds, but with a ~1h TTL by default |
| Distributed traces | Batch span processor → collector → store | ~5–60s, sampled |
| Cloud audit / change events | Provider delivery pipeline | ~5–15 min, and not strictly ordered |
| Declared state (K8s API, live) | Direct API read | Immediate, authoritative |
Note what that table does to a timeline. The signals that describe symptoms are fast. The signal that describes the cause — a change record — is the slowest thing in the system, often by an order of magnitude.
So when an agent reasons at T+90 seconds, it has: rich symptom evidence, and a change record that will not exist for another twelve minutes.
That is not a small inconvenience. It is an inversion of the exact ordering causality requires.
Why the human never noticed
This is worth dwelling on, because it explains why the problem is invisible in every existing product.
Put a human on the incident. They get paged at T+3 minutes. They open a dashboard, look at the latency graph, read some logs, form a hypothesis, check the wrong thing first, get a coffee, come back, and check the deploy history at T+18 minutes.
By T+18 the audit trail has landed. The record settled while they were being slow. Human investigation is slower than the slowest ingestion lag, so the skew is completely masked. Every dashboard, every alert, every runbook in this industry was designed by and for people operating in that regime.
Now put an agent on the same incident. It gets the signal at T+30 seconds and reasons immediately — that speed is the entire value proposition. And at T+30 seconds the change record is not there.
Autonomy did not create the skew. Autonomy removed the accident that was hiding it.
The specific failure mode: absence read as absence
Here is the precise mechanism, because this is where the real damage happens.
When an agent queries a change log for a window and gets zero results, there are two very different possible worlds:
- Nothing changed in that window. A legitimate and useful finding — it eliminates a whole hypothesis class and correctly redirects toward capacity, load or an external dependency.
- Something changed, and the record has not been delivered yet. The most dangerous state in the system.
The query result is byte-for-byte identical in both worlds.
A naive agent treats world 2 as world 1. It concludes "no recent changes," eliminates the change-driven hypothesis class, and reasons on toward capacity or a dependency problem. Its conclusion is well-argued and confidently stated. It is also exactly backwards, and it was caused by a missing row rather than a bad inference.
The consequences compound:
- Wrong action. Scale up a deployment when the real cause was a revoked network rule. You have now added an unlogged change to your incident timeline and made the eventual diagnosis harder.
- False confidence. Ruling out the change hypothesis is a strong signal downstream. Every subsequent reasoning step inherits it.
- Unreproducible postmortems. Re-run the same query an hour later and the event is there. The agent's reasoning is now indefensible in review, and nobody can reconstruct why it did what it did — which is a governance problem as much as a technical one.
- Learning poisoned. If the system learns from outcomes, it has just recorded a case where its stated cause was wrong and its action appeared to help or not help for unrelated reasons. That is worse than learning nothing.
There is a second-order version too. Because logs and metrics arrive at different speeds, an agent can observe a log line describing a consequence before it observes the metric describing the trigger, and construct a causal chain in the wrong direction: treating the consequence as the cause because the consequence's evidence arrived first. Same defect, one hop earlier.
How topology mapping accelerates root cause analysis: one incident, three architectures
An orders-api failure, with the timeline of what each architecture actually knows at the moment it decides.
Ground truth
- 09:51:07 — A GitOps sync applies a change to orders-api, lowering the container memory limit from 1Gi to 768Mi. The author was reducing over-provisioning based on a p50 working-set graph. Steady-state working set is around 700Mi; the p99 under batch load is 940Mi.
- 09:51:20 — Rollout begins. New pods start, healthy.
- 09:52:30 — The hourly reconciliation batch starts, as it does every hour.
- 09:53:04 — First pod exceeds 768Mi and is OOMKilled.
$ kubectl describe pod orders-api-6f8b47d9c5-mn2wq
Last State: Terminated
Reason: OOMKilled
Exit Code: 137
Started: Wed, 19 Aug 2026 09:52:31 +0000
Finished: Wed, 19 Aug 2026 09:53:04 +0000
- 09:53:10 onward — Pods cycle. CrashLoopBackOff. Order submissions fail. The page fires at 09:53:40.
Architecture A — centralized, reasoning at 09:54:10 (T+30s)
What has arrived centrally:
- ✅ Container restart metric — spiking
- ✅ orders-api error rate — spiking
- ⚠️ Container memory working-set — the last point is 09:52:45, before the OOMKill. The kill and the memory ceiling it hit are not visible yet
- ❌ Pod logs for the terminated container — log agent has not shipped them; the container is gone
- ❌ Kubernetes event OOMKilling — not exported yet
- ❌ GitOps deploy record / audit event for the 09:51 change — ~12 minutes away
So the agent sees: restarts, errors, memory that looked fine as of its last data point, and no recorded changes. Its best-supported hypothesis is a load-driven crash from the batch job — which is the one thing that is genuinely correlated in the data it has. A defensible, well-argued, wrong conclusion. If it is permitted to act, the likely action is to scale the deployment, which adds more pods that each hit the same 768Mi ceiling.
Architecture B — centralized, reasoning at 10:06 (T+12min), waiting for the record to settle
Now everything has landed. The agent correctly identifies the memory-limit change and its relationship to the batch load. Its diagnosis is right.
It is also twelve minutes late. Orders have been failing for thirteen minutes. This is the honest cost of the safe centralized approach: correctness bought with the exact latency autonomy was supposed to eliminate. And "wait for the slowest source" means every incident inherits the worst-case lag in your estate, whether or not this incident involved a change at all.
Architecture C — cluster-resident agent, reasoning at 09:53:52 (T+12s)
The agent runs in the cluster. What it can read directly, without waiting for any pipeline:
- The live Kubernetes API: the pod's
lastState.terminated.reason = OOMKilled,exitCode: 137, and the container's currentresources.limits.memory = 768Mi. Immediate and authoritative — this is declared state, not telemetry. - The local kubelet / cgroup working-set values at full resolution for the seconds before the kill, on the local host clock.
- The container's own log buffer for its final seconds — still available locally, because the agent is on the node rather than downstream of a shipping pipeline.
- The object's own revision history:
Deployment.metadata.generation, and the ReplicaSet lineage — the previous ReplicaSet's pod template still carries the 1Gi limit. The change is discoverable from cluster state itself, without any audit pipeline.
That last point is the crux. The declared-state layer contains both the current value and evidence of the previous one. The agent does not need the slow audit trail to establish that the limit changed; it needs the audit trail only to establish who changed it and why, which matters for the postmortem, not for the fix.
Diagnosis at T+12 seconds: memory limit reduced below the workload's p99 working set; the hourly batch is the activating condition, not the cause. Stabilize by restoring the previous limit, then verify no OOMKill recurs across the remainder of the batch window. When the audit event lands twelve minutes later, it is appended to the evidence chain as attribution — confirming a GitOps sync and its author — rather than being a prerequisite for action.
Same incident. Same model. Twelve seconds versus twelve minutes versus wrong, decided entirely by where the agent sits relative to the data.
Two mechanisms that actually fix it
1. Locality: one clock, one place
Running the agent where the data is born collapses the skew rather than compensating for it.
- One clock. All local evidence is timestamped by the same host clock, so ordering between a cgroup memory reading and a log line written 200ms later is real ordering, not an artifact of two pipelines with different buffering.
- No pipeline in the read path. Declared state is read from the API server directly. Local logs are read from the local buffer. Nothing is waiting on a shipper, a queue, or an indexer.
- Full fidelity available on demand. Because the agent is present at the moment of the fault, it does not need a retained archive — it can ask for full resolution now, scoped to the blast radius. That is fault-driven fidelity: cheap and coarse in steady state, full resolution only where and when a fault is unfolding.
- Privacy as a side effect. Sensitive logs and traces never leave the cluster; only small summarized signals and outcomes do. The architecture that fixes the ordering problem is the same one that satisfies a data-residency review, which is a rare thing to get for free.
2. Source watermarking: know what you don't know yet
Locality solves everything inside the cluster. It does not solve the genuinely external sources — cloud audit trails, provider-side metrics, another region's control plane. For those, the agent must be explicit about freshness.
Every source carries a declared freshness lag. For any evidence window, the agent computes a watermark: the most recent timestamp for which every required source is known to have settled.
The rule that follows:
No causal attribution, or action based on it, on an unsettled evidence window.
Concretely, for a window ending at T_now:
watermark = min over sources s of ( T_now − known_lag(s) )
if the hypothesis depends on a source whose data is newer than the watermark:
→ the correct state is "unknown", never "absent"
→ permitted: deterministic stabilization within pre-approved guardrails
→ not permitted: causal attribution, or any action justified by that attribution
→ re-evaluate when the watermark advances past the window
The important design detail is the middle line. "Unknown" and "absent" must be different values in the agent's reasoning. Nearly all of the damage in this class comes from a system that conflates them.
And note that this is what makes the two-phase order of operations necessary rather than merely clever. Stabilization is guardrailed, reversible, and does not require a causal claim — so it can proceed immediately. Attribution requires a settled window — so it waits. If your architecture forces one decision for both, you must choose between acting late and acting on a guess.
Where DataAgent fits
Everything above is a property of distributed systems, not of our product. Here is what we built into DataAgent, an autonomous observability and remediation platform:
- Cluster-resident agents. Lightweight agents run on your clusters and process signals at the source, on the local host clock. Only small summarized signals leave. This is what makes the twelve-second path in the worked example possible.
- TIDE maintains a versioned graph of entities, configuration, relationships and drift history read directly from control planes — the declared-state layer that carries change evidence without waiting for an audit pipeline.
- PULSE is thin, low-data in-cluster detection in steady state; full-fidelity retrieval is triggered by a fault and scoped to the blast-radius window.
- Source watermarking is an explicit part of the Trust Ladder: no causal attribution, or action based on it, is made on an unsettled evidence window, and known provider lags — including cloud audit delivery that runs to minutes with no guaranteed ceiling — are respected by design rather than discovered in a postmortem.
- STEER gates on that basis, and routes to a human with the reason stated when the window has not settled. WAKE learns only from verified outcomes, which is what keeps a skew-corrupted case out of the training signal.
- The two-phase order of operations — deterministic circuit breaker in seconds, deep RCA in parallel — is the direct architectural consequence of taking watermarking seriously.
- Multi-cluster system health control plane for orchestration across clusters, where each cluster keeps its own locality and only summaries are federated.
FAQ
What is the causality skew? Different evidence classes reach a central store at different speeds — metrics in seconds, logs in tens of seconds, cloud audit events in roughly five to fifteen minutes. An agent reasoning immediately after a fault therefore sees symptoms but not causes, and can build a causal chain in the wrong order. Human investigators do not notice because they take longer to investigate than the slowest lag.
Why does an audit-trail delay matter so much if it's only minutes? Because absence of a record is silently read as absence of a change. Five to fifteen minutes is short for a human and enormous for an agent that decides in thirty seconds. Reading "no changes found" as "nothing changed" eliminates the correct hypothesis class, and every subsequent reasoning step inherits that error confidently.
Can't you just make the agent wait until the data has settled? You can, and it is the safe default for causal attribution — but waiting means every incident inherits the worst-case lag in your estate. The better answer is to split the decision: stabilize immediately within pre-approved guardrails, since stabilization needs no causal claim, and defer attribution until the window has settled.
How does a cluster-resident autonomous agent actually help? It reads declared state from the Kubernetes API and local signals from the local host, so there is no shipping pipeline in the read path and everything shares one clock. Crucially, the cluster's own state carries change evidence — object generation, ReplicaSet lineage, the previous ReplicaSet's pod template — so a change can be established without waiting for an external audit trail.
What role does topology awareness play in effective remediation automation? It decides whether the action is aimed at the cause or at a symptom. An agent that knows which Deployment owns which ReplicaSet, what changed on that object and when, and what else sits in the blast radius can restore the previous configuration instead of scaling into the same failure. It also bounds the action: a guardrailed rollback scoped to one workload is safe to take before attribution settles, while an action without topology context is a guess with side effects.
Isn't keeping telemetry in-cluster mainly a privacy feature? It satisfies data residency, yes, and that is often what gets it approved. But the technical reason to do it is correctness: locality is what gives you a single clock and an unbuffered read path. The privacy benefit is real and is a side effect of the ordering fix.
What is source watermarking? Attaching a known freshness lag to every evidence source, then computing, for any window, the most recent timestamp at which all required sources have settled. The agent may not make a causal claim — or act on one — about data newer than that watermark. Its internal state for such data must be "unknown," never "absent."
Key takeaways
- Central stores do not just show a late picture; they assemble it in the wrong order, because symptom evidence is fast and change evidence is slow.
- Human investigators are slower than the slowest ingestion lag, which is why every existing dashboard hides this problem. Autonomy removed the accident that was hiding it.
- The core defect is conflating "not arrived yet" with "did not happen." Those must be distinct values in an agent's reasoning.
- Running the agent where the data is born gives one clock and no pipeline in the read path — and the cluster's own declared state carries change evidence without any audit trail.
- Watermark every external source and never make a causal attribution, or act on one, on an unsettled window. Stabilize immediately, since stabilization needs no causal claim; attribute later, when the evidence has settled.
- #causality skew
- #root cause analysis
- #topology mapping
- #autonomous remediation
- #Kubernetes
- #incident response
- #AI SRE
- #source watermarking
See remediation-first in your own stack
Install an agent and watch DataAgent map your topology. No credentials, no commitment.
Keep reading
 Engineering13 min
Jev Named the Layer. Now Somebody Has to Measure It.
A model that only makes decisions is the right idea for autonomous operations. But the number that autonomous action depends on is still unmeasured, by the vendor, by the press, and by the first paper built on it.
Nati Shalom • Nov 1, 2026 Engineering10 min
Nobody Can Tell You What Observability Really Costs
Every observability vendor bills in a different unit. We priced one fixed Kubernetes workload with each vendor's own model to show the real cost, why the cheapest option changes as you grow, and why the curve doesn't scale.
Nati Shalom • Nov 1, 2026 Engineering13 min
Who Is the Dashboard For?
A self-driving car has no dashboard and more sensors than ever. The same inversion is coming for cloud observability: less data, a sharper picture, and a new answer to multi-cloud.
Nati Shalom • Nov 1, 2026