How to Reduce MTTR: The Slowest Part of Your Incident Is a Human Reading a Graph
Detection takes seconds. Everything after it is a person reading graphs, forming a theory, acting and verifying. That is where MTTR lives, and why remediation-first systems that detect, diagnose, act and verify bring it down further than another dashboard or assistant.
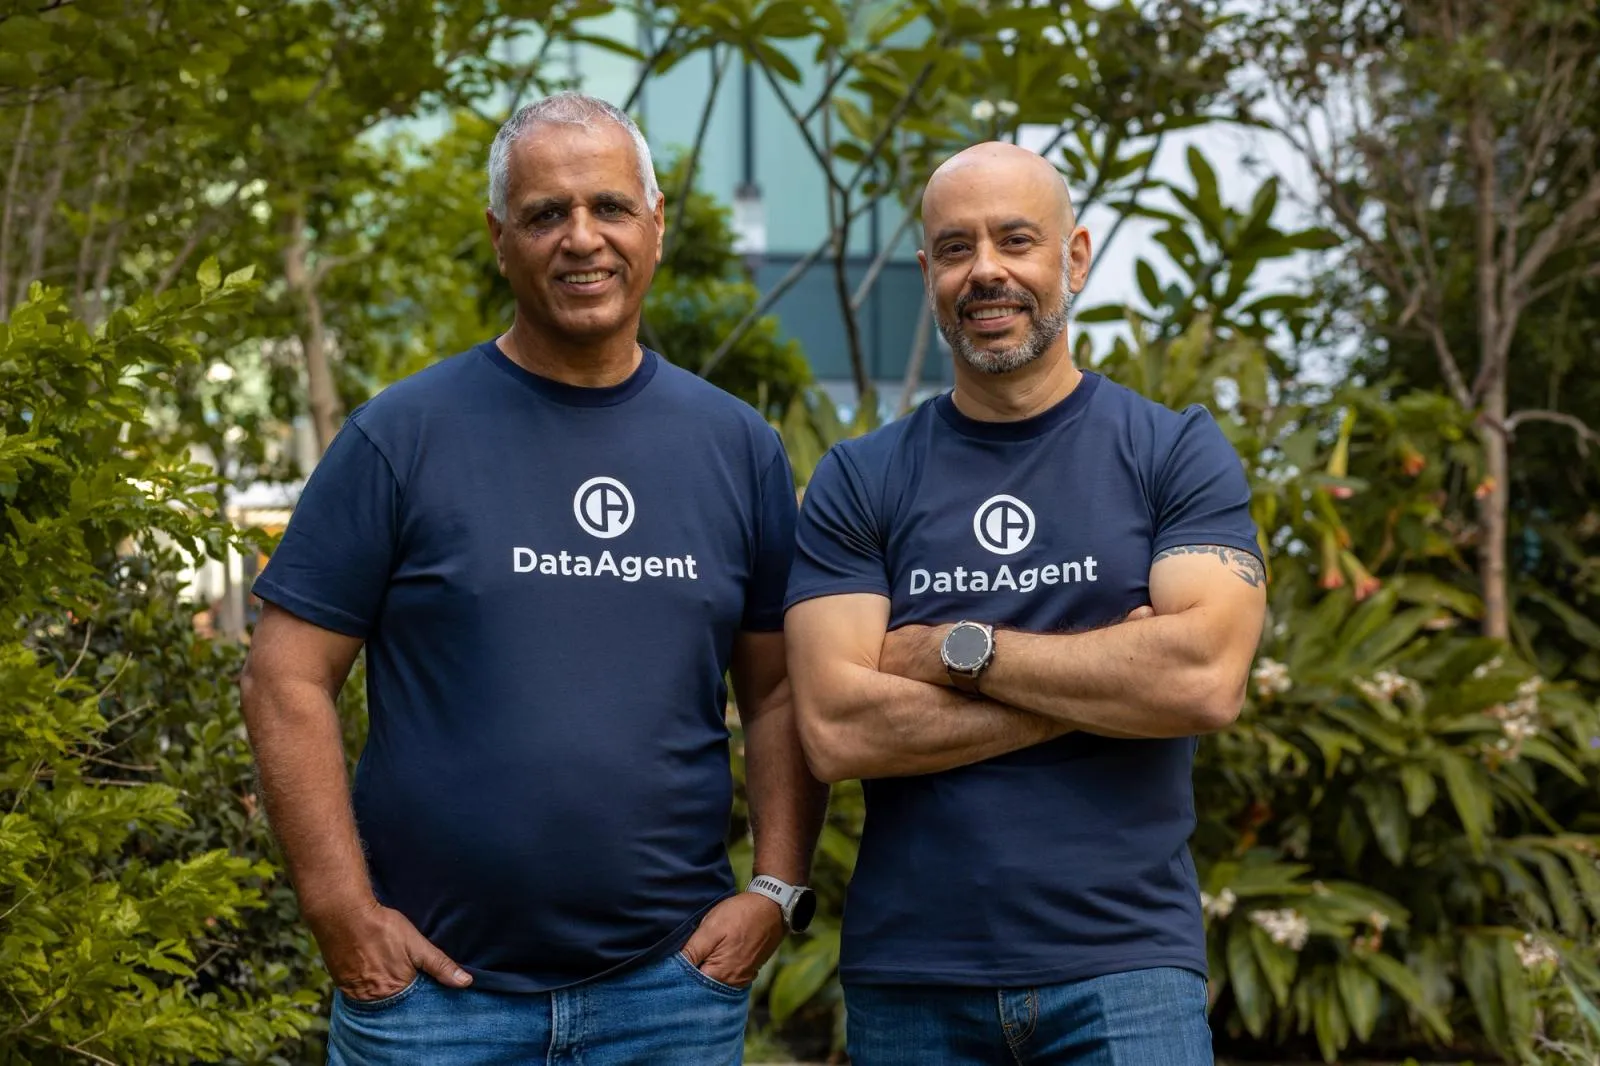 Nati ShalomCo-founder & CTO
Detection takes seconds. Everything after that is a person, and that is where your MTTR actually lives.
Break an incident down and look at where the minutes go. Detection is fast: machines are excellent at noticing that a metric diverged, and the alert fires within seconds of the threshold breach.
Everything after that is a human. Someone gets paged. Someone wakes up. Someone opens a dashboard and starts reading graphs, forming a theory, testing it, acting on it, and then watching to see whether the fix held.
That sequence (read, theorize, act, verify) is your mean time to resolution. Not the detection. The human. If you want to reduce MTTR in a way that lasts, that is the step you have to change.
Key takeaways
- Most of MTTR sits after detection, in human diagnosis, remediation and verification.
- Cost-driven down-sampling means engineers diagnose incidents on the coarsest data, at the moment they need the sharpest.
- AI SRE assistants that recommend but do not act add a verification step instead of removing one.
- Remediation-first systems run detect, diagnose, act, verify, and escalate only the exceptions to a human.
- MTTR drops furthest when the system learns from every incident outcome, per failure type.
What is MTTR, and what does it actually measure?
MTTR is the average time it takes to restore a service after an incident starts. Teams use the acronym for four related metrics, so it is worth being precise about which one you track:
| Metric | Clock starts | Clock stops |
|---|---|---|
| Mean time to repair | Repair work begins | The system works again, including testing |
| Mean time to recovery | The failure begins | Service is restored for users |
| Mean time to resolution | The incident is detected | A long-term fix is in place to prevent recurrence |
| Mean time to respond | The alert fires | Service is fully restored |
MTTR usually sits alongside MTBF (mean time between failures) and MTTD (mean time to detect) in a reliability metrics framework.
Here is the point most MTTR guides skip: in mature environments, MTTD is often already short. The expensive part of mean time to resolution is not finding out that something broke. It is everything a person does next.
Where the minutes go: the anatomy of an incident
Only the first phase of an incident belongs to the machine. Every phase after it waits on a person:
- Detect. The alert fires. This takes seconds, and it is the one phase monitoring vendors have spent fifteen years optimizing.
- Page and wake. The on-call engineer is notified, acknowledges (tracked as MTTA, mean time to acknowledge), and gets to a laptop. At 2 a.m. this alone is measured in minutes.
- Orient. The engineer opens dashboards, logs and traces, and works out what changed and what is affected.
- Diagnose. They form a theory about the root cause and test it against the data.
- Remediate. They roll back, restart, scale, fail over, or patch.
- Verify. They watch the graphs to confirm the fix held and nothing else broke.
Phases 2 through 6 are human time. That is why adding another alerting or monitoring tool rarely moves MTTR: it speeds up the phase that was already fast. To reduce mean time to resolution, you have to shorten or remove the human phases, starting with orient and diagnose.
The 2 a.m. problem: diagnosing on down-sampled data
The data your on-call engineer reads during an incident was coarsened in advance to keep the observability bill survivable. Metrics are often averaged into 60-second rollups. The highest-cardinality labels are stripped. Traces are sampled down to a fraction.
It had to be done. You pay to retain all of that telemetry, all the time, for someone who might one day look at it. So teams control observability costs with a static trade: less data everywhere, always.
The cost of that trade lands at the worst moment. At 2 a.m., in the middle of the incident, your engineer is squinting at down-sampled data exactly when they need it sharpest. A 60-second average can hide a 5-second spike. A dropped label can hide which tenant, pod or region is failing. A sampled-out trace can hide the one slow call that explains everything.
Static cost control trades away accuracy at the point of decision. That directly inflates the orient and diagnose phases, which are already the longest part of MTTR.
Why AI SRE assistants alone do not reduce MTTR
The new wave of AI SRE assistants identifies a probable root cause, drafts a remediation plan, and walks the engineer through a resolution. That sounds like help. Under incident pressure, it hands the on-call engineer one more artifact to check before acting.
That artifact is a confident recommendation. It may be right. It may be subtly wrong. Either way, it is now the engineer's responsibility to adjudicate, on the same down-sampled data, at the same hour. More AI output, more to check, same bottleneck.
A smarter thermometer that writes you a memo about what it thinks you should do is not a thermostat. It is a thermometer with opinions.
The coding world already ran this experiment
Software teams adopted AI assistants first, and the result was an AI code review bottleneck, not a productivity leap. Sonar's 2026 State of Code Developer Survey of more than 1,100 developers found:
- 96% do not fully trust that AI-generated code is functionally correct.
- Only 48% always verify it before committing.
- 38% say reviewing AI code takes more effort than reviewing a colleague's code.
Put differently, more than half of developers do not consistently pay the verification tax, even though almost none fully trust the output. The same pattern is now arriving in operations, dressed as progress: AIOps that recommends, and humans who either verify slowly or stop verifying.
How to reduce MTTR: move from dashboards to remediation-first
You do not shrink MTTR by making the human faster at reading graphs. You shrink it by removing the read-a-graph-and-form-a-theory step for the incidents that do not need it.
A remediation-first system inverts the order of operations the last fifteen years trained us into. Instead of observe, display, then wait for a human to investigate, decide and act, it runs detect, diagnose, act, verify, and escalates to a human only for the genuine exceptions.
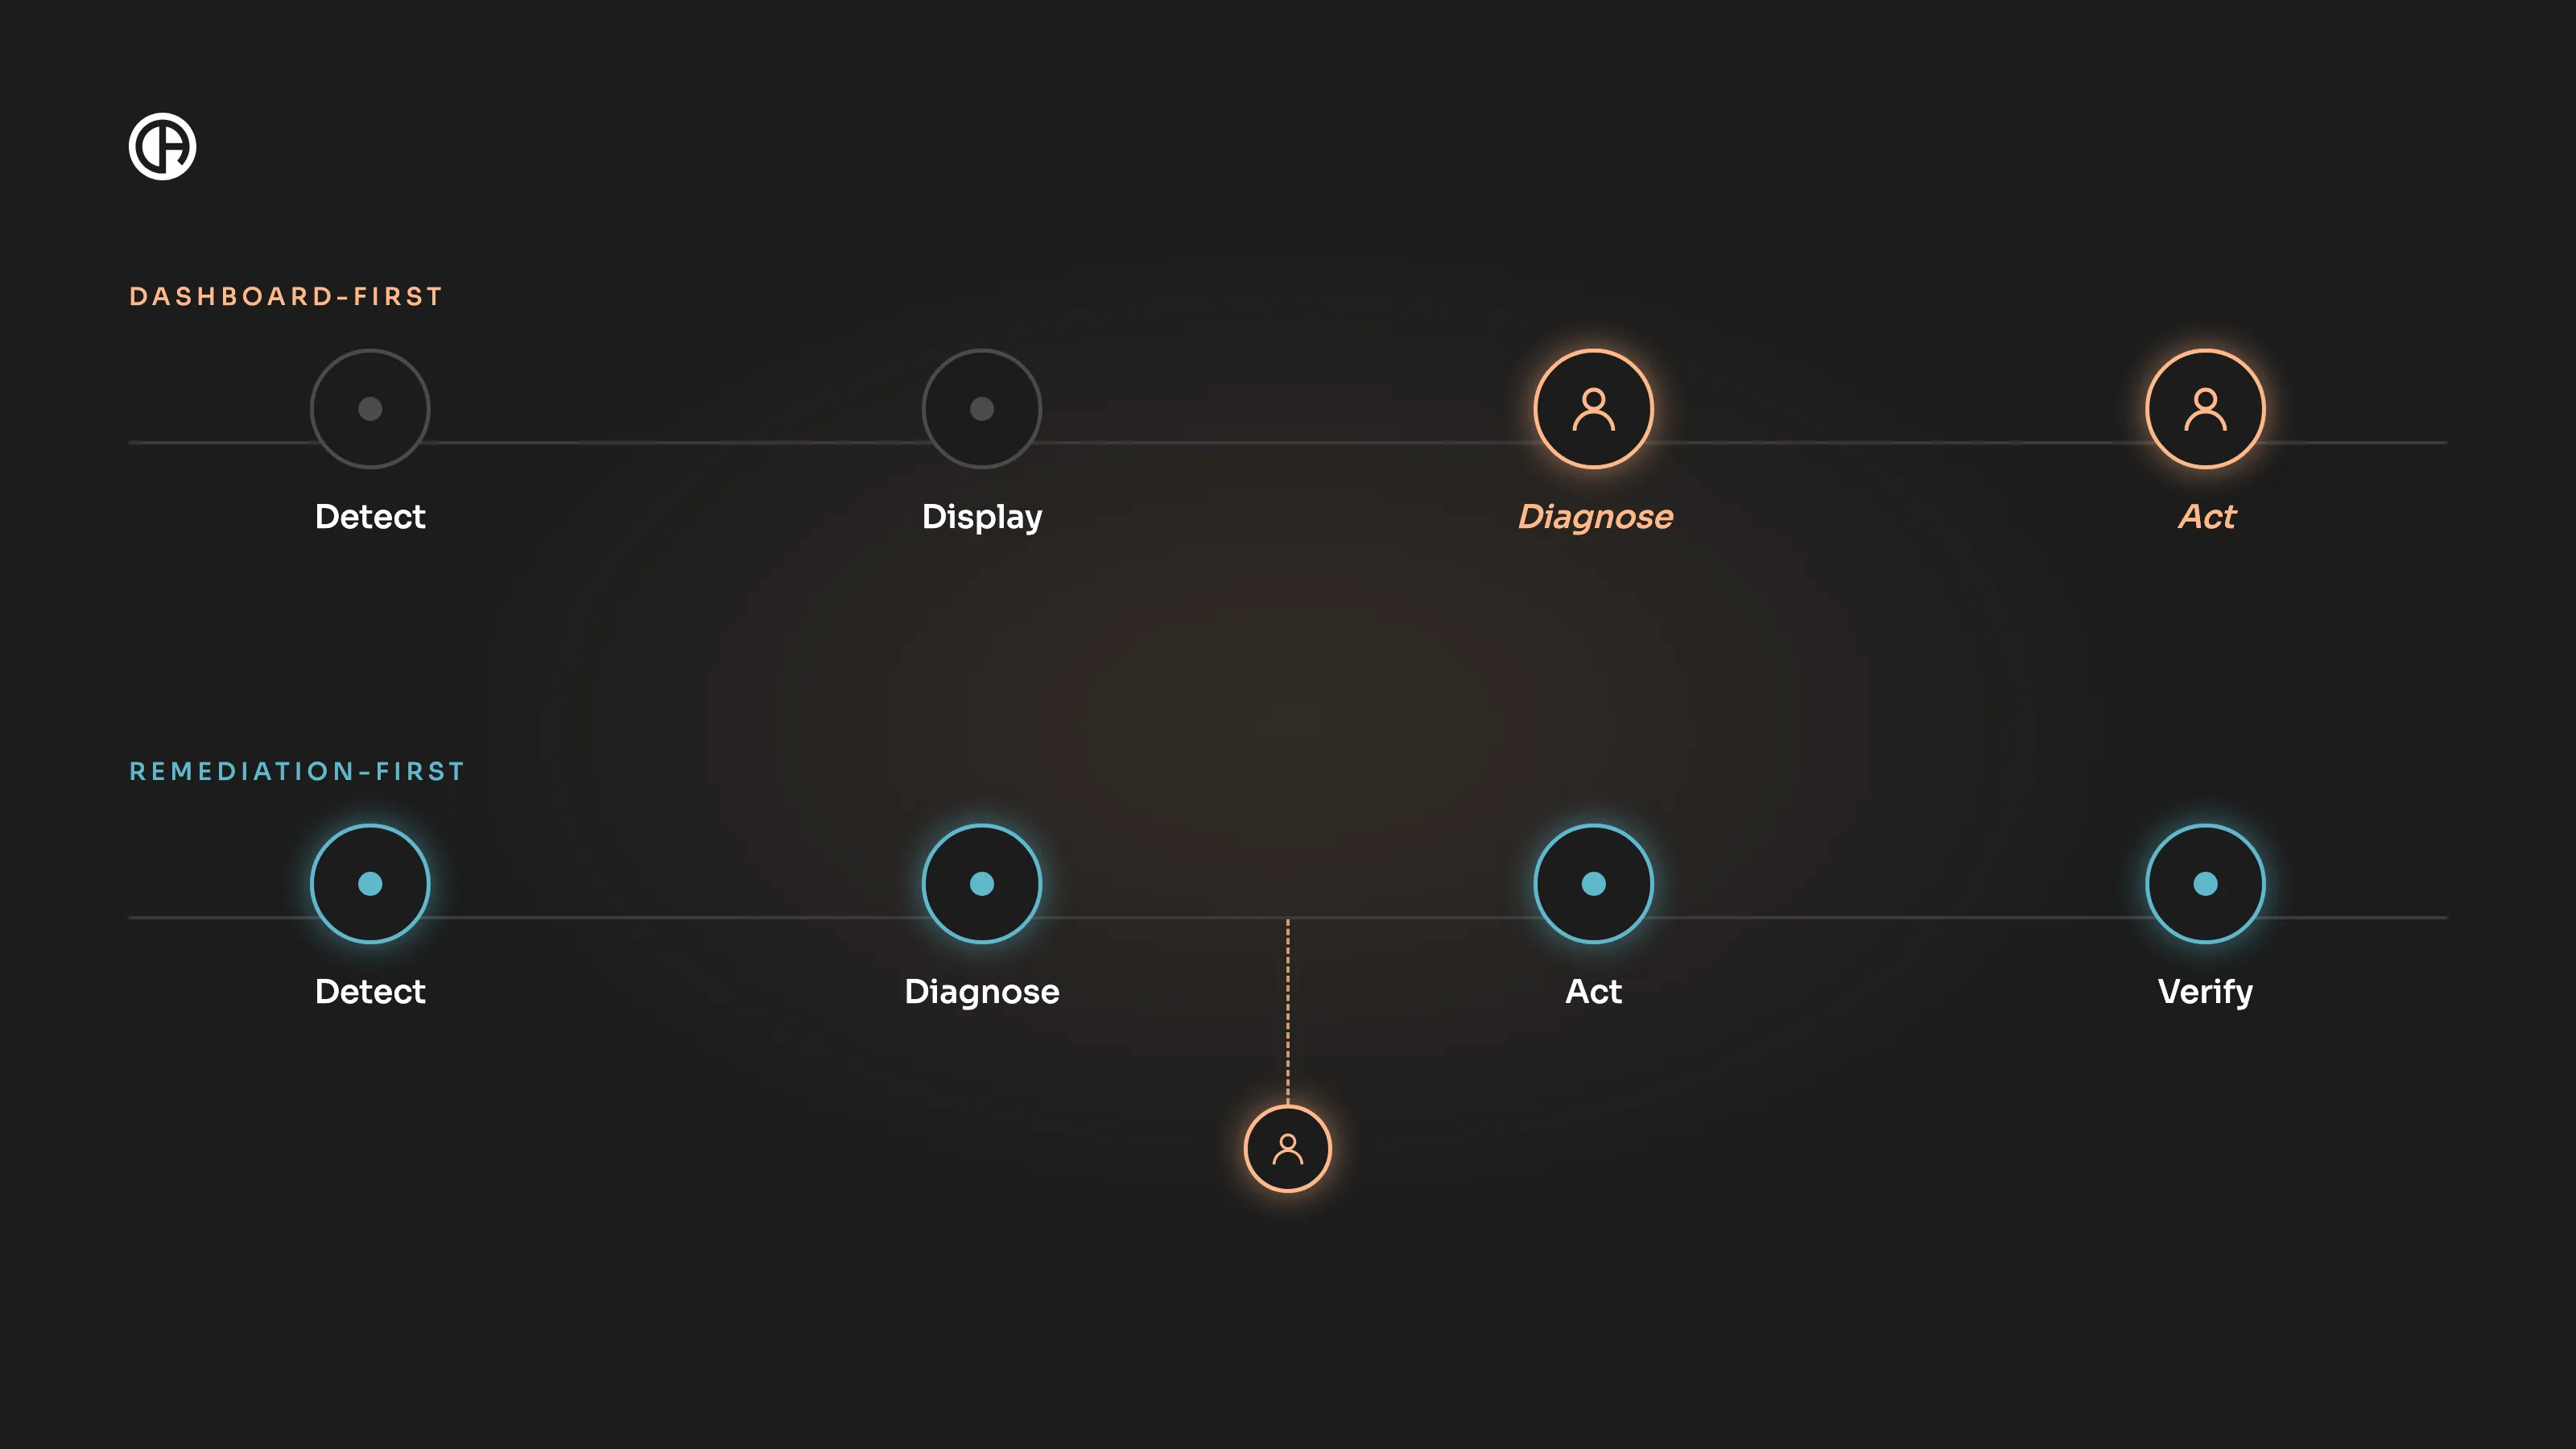
In the dashboard-first model, three of five steps are human time. In the remediation-first model, the human appears only on the low-confidence branch. Three things change.
1. Fidelity flips to the fault
An agent runs cheap and coarse in steady state, then raises sensing to full resolution precisely where and when a fault is unfolding. At the decision point it has more detail than the human dashboard, not less. This resolves the 2 a.m. problem: you stop paying for full fidelity everywhere and get it exactly where the incident is.
2. Verification moves into the loop
The system checks that its action actually restored health, the way an immune response confirms a threat is cleared. That is different from both failure modes above. It is not "verify harder by hand" (the assistant tax), and it is not "act without checking" (automating the failure). It is autonomy with verification built in, done continuously by the system instead of occasionally by an exhausted human.
3. The system learns from every incident
A dashboard's accuracy is frozen the day you build it. A panel never gets smarter from how an incident turned out. An agent acts, checks whether the fix worked, and feeds that verdict back, so its diagnosis sharpens with every incident, per failure type. MTTR does not just drop. It compounds downward.
This is the core of automated remediation done safely: closed-loop, verified, and improving.
Dashboards vs AI SRE assistants vs remediation-first
Only a remediation-first AI SRE removes human steps from routine incidents; the other two make the same human faster or give them more to read.
| Dashboard-first monitoring | AI SRE assistant | Remediation-first | |
|---|---|---|---|
| Who diagnoses | Engineer | Assistant proposes, engineer confirms | System, escalates low-confidence cases |
| Who acts | Engineer | Engineer | System, within guardrails |
| Who verifies | Engineer, by watching graphs | Engineer | System, continuously |
| Data fidelity at decision time | Down-sampled | The same down-sampled data | Full resolution at the fault |
| Learns from outcomes | No | Rarely closed-loop | Yes, per failure type |
| Effect on MTTR | Bounded by human speed | Adds a verification step | Removes human steps for routine incidents |
| Human role | Operator | Reviewer | Handles exceptions and sets policy |
Where to start: 7 practical steps to reduce MTTR
Incident response automation pays off fastest when you start narrow: one recurring failure type, full autonomy with verification, then expand. A practical sequence:
- Measure MTTR per failure type, not as one average. A single blended number hides the few incident classes that drive most of your downtime.
- Find your most frequent, well-understood incidents. Disk pressure, stuck deployments, pod crash loops and certificate expiry are typical candidates. These are where a human reading a graph adds the least.
- Codify the diagnosis, not only the fix. Many runbook automation efforts script the remediation but leave diagnosis to a human, so MTTR barely moves.
- Define verification criteria before you automate the action. Decide what "healthy" means in measurable terms, so the system can confirm recovery without someone watching.
- Set guardrails and a blast radius. Limit which actions can run autonomously, on which services, and how often, and roll back automatically if verification fails. Guardrails are what make autonomous SRE safe to run in production.
- Define escalation rules. Low confidence, novel signatures and failed verification go to a human, with the full-resolution context already attached.
- Close the loop. Feed each outcome back so diagnosis improves per failure type, then expand to the next class of incident.
Track the result where it shows up: fewer pages, less on-call burnout, and an MTTR trend that keeps falling quarter over quarter.
The Digital Immune System: where this is heading
Gartner named the Digital Immune System one of its top strategic technology trends for 2023 and predicted that, by 2025, organizations investing in digital immunity would reduce system downtime by up to 80%. Its definition combines observability, auto-remediation, chaos engineering, site reliability engineering, AI-augmented testing and software supply chain security to make systems recover quickly from failures.
The immune metaphor is exact. Your immune system does not page you when it detects a pathogen and wait for approval. It senses, decides and acts, and tells you afterward, if at all. Remediation-first operations apply the same logic to production systems. For a deeper look at the model, see why observability alone can't fix AI-era production.
The transition will not announce itself
This will not happen with a bang. The cockpit just gets quieter every quarter. Fewer people open the dashboard at 2 a.m., because fewer incidents need a human to read a graph and form a theory.
The fastest incident is not the one you resolved quickly. It is the one that never needed you awake.
See how DataAgent reduces MTTR with verified, autonomous remediation
Detect, diagnose, act and verify, with a human only on the exceptions. See it on your own Kubernetes and AWS environment.
Frequently asked questions
How do you calculate MTTR?
Divide the total incident time in a period by the number of incidents in that period.
MTTR = total incident time in the period ÷ number of incidents in the period
Four incidents lasting 20, 45, 90 and 25 minutes give 180 / 4 = 45 minutes. Two details keep the number honest. First, fix the start and stop timestamps for every incident (for example, alert fired to service verified healthy). Second, report the median next to the mean, because one long outage can make a single average misleading.
What is the difference between MTTR, MTBF and MTTD?
MTBF (mean time between failures) measures how often things break. MTTD (mean time to detect) measures how quickly you notice. MTTR measures how quickly you restore service. Together they describe reliability: MTBF is about preventing failures, MTTD and MTTR are about limiting their impact.
How does MTTR relate to DORA metrics?
DORA's closest metric is failed deployment recovery time (renamed from time to restore service in 2023). It measures recovery only for failures caused by a change to production, while MTTR usually covers every incident, including infrastructure and dependency failures.
What is the difference between runbook automation and auto-remediation?
Runbook automation scripts the fix, but a human still decides when to run it. Auto-remediation also makes that decision: it matches the incident to a known failure type, runs the fix, and checks the result without waiting for an engineer.
Which incidents should not be remediated automatically?
Keep a human in the loop for novel incidents with no known signature, suspected security incidents, and actions that are hard to reverse, such as deleting data or changing access controls. Incidents that span many services at once also warrant human judgment until the system has a track record on them.
What is a good MTTR?
There is no universal benchmark for MTTR itself, because it depends on service criticality and incident type. The closest public reference is DORA's failed deployment recovery time: in the 2024 DORA report, elite teams recovered in less than an hour, while low performers took between one week and one month. For your own services, the more useful target is a falling MTTR per failure type, tracked quarter over quarter.
Sources
- Sonar, State of Code Developer Survey report (Jan 2026)
- Gartner, Gartner Identifies the Top 10 Strategic Technology Trends for 2023 (press release, Oct 2022)
- DORA, Accelerate State of DevOps Report 2024 (recovery benchmark, p. 13)
- DORA, A history of DORA's software delivery metrics (2023 rename)
- Atlassian, Common incident management metrics (MTTR definitions)
- #MTTR
- #Incident Response
- #Remediation-First
- #Autonomous SRE
- #AIOps
- #Observability
- #Self-Healing
See remediation-first in your own stack
Install an agent and watch DataAgent map your topology. No credentials, no commitment.
Keep reading
 Engineering7 min
What You Won’t Hear at ObservabilityCON
The stage shows an AI agent on top of your data cloud. The people who carry the pager, when no vendor is in the room, describe something else: an agent that goes to the data, a backend that becomes storage, and a bill that stops charging for a reader who has left.
Nati Shalom • Oct 15, 2026 Engineering14 min
Who Pays for the Dashboard?
We priced one Kubernetes-on-AWS workload across observability backends. Copying telemetry into a SaaS platform costs 5–9× the open-source floor, and an autonomous agent uses none of what the premium buys. Build the substrate cheap; fund the loop.
Nati Shalom • Oct 11, 2026 Engineering11 min
Is AI Making Your SRE Team Better? Ask the Scale, Not the Mirror
AI makes engineers faster at producing changes and makes production less stable. Which effect wins depends on your platform. Four production numbers tell you whether AI is actually making your SRE team better.
Shahar Harap • Oct 11, 2026