When They Go Wide, We Go Deep
Every pod was Ready, every log was clean, and the alert named the wrong service. A real Kubernetes incident, and why an autonomous SRE needs depth, not more integrations, to fix it.
 Nati ShalomCo-founder & CTO
Every pod was Ready. Every log was clean. The alert named the wrong service. That is the incident an autonomous SRE has to solve on its own, and no number of integrations solves it. It takes depth: how your system is wired, what just changed, and the last few hours of signals.
Every pod was Ready. Every log was clean. Checkout was taking more than a second per order, and the alert pointed at the checkout service, which had nothing wrong with it. If you run Kubernetes in production, you have lived some version of this incident. It is also the incident that separates an agent that fixes from one that guesses, for a reason that has little to do with the model.
The common answer to this incident is more data. Connect the agent to more systems: tickets, wiki, chat history, every log line you ever stored. The assumption is simple: the more of your organization an agent can read, the better it gets at fixing production.
It sounds right. In our testing, it is mostly wrong. Past a point, more organizational data makes an autonomous agent slower, more expensive and less accurate. What made the difference in this incident was something else: knowing how the system is wired.
The driving history of every driver
Self-driving cars are the cleanest way to see why. Imagine you could give a self-driving car the complete driving history of every driver in a company. Millions of hours. What would it learn?
Mostly, the same thing over and over: drive straight, slow down, turn. And a lot of what is in there is not driving you would want copied. Rushed lane changes, near misses, habits. The archive is huge, repetitive and of mixed quality.
What actually keeps the car on the road is something else: what its cameras, radar and lidar see right now, a detailed map of the road, and the traffic around it this minute. History still has a job. It helps you learn patterns of decisions and behavior. But for that, a good sample is enough. You do not need every trip ever taken to know that a red light means stop.
What actually helps an autonomous agent
The same holds for an autonomous SRE. Access to your ticket system, your support tools, even your internal knowledge base, often adds little at incident time. Sometimes it hurts. Research on long inputs shows models get less reliable as the context grows, and they tend to miss facts buried in the middle of a long prompt. Every extra document also costs tokens to read, on every incident.
Three kinds of knowledge do help, at different times:
- Patterns, learned once, up front. Which kinds of faults this system has had. Which application metrics you defined to know whether the service meets its goals. This belongs in discovery and onboarding, not in the middle of an outage.
- Deep knowledge of the wiring, all the time. The live topology: what calls what, which components are shared, what each workload depends on, and what changed recently.
- Logs and metrics, fresh. They matter most in real time, and their value drops fast as they age. An error rate from last Tuesday rarely explains tonight’s incident.
The second is where most of the value is, and the integration count never measures it.
A database that got slow without going down
Here is a real incident, run end to end on our own test cluster on 7 November 2026. It came from a team running a large GPU training cluster, where slow storage had stalled whole training runs. We rebuilt the same failure on a plain web shop so we could test it repeatedly.
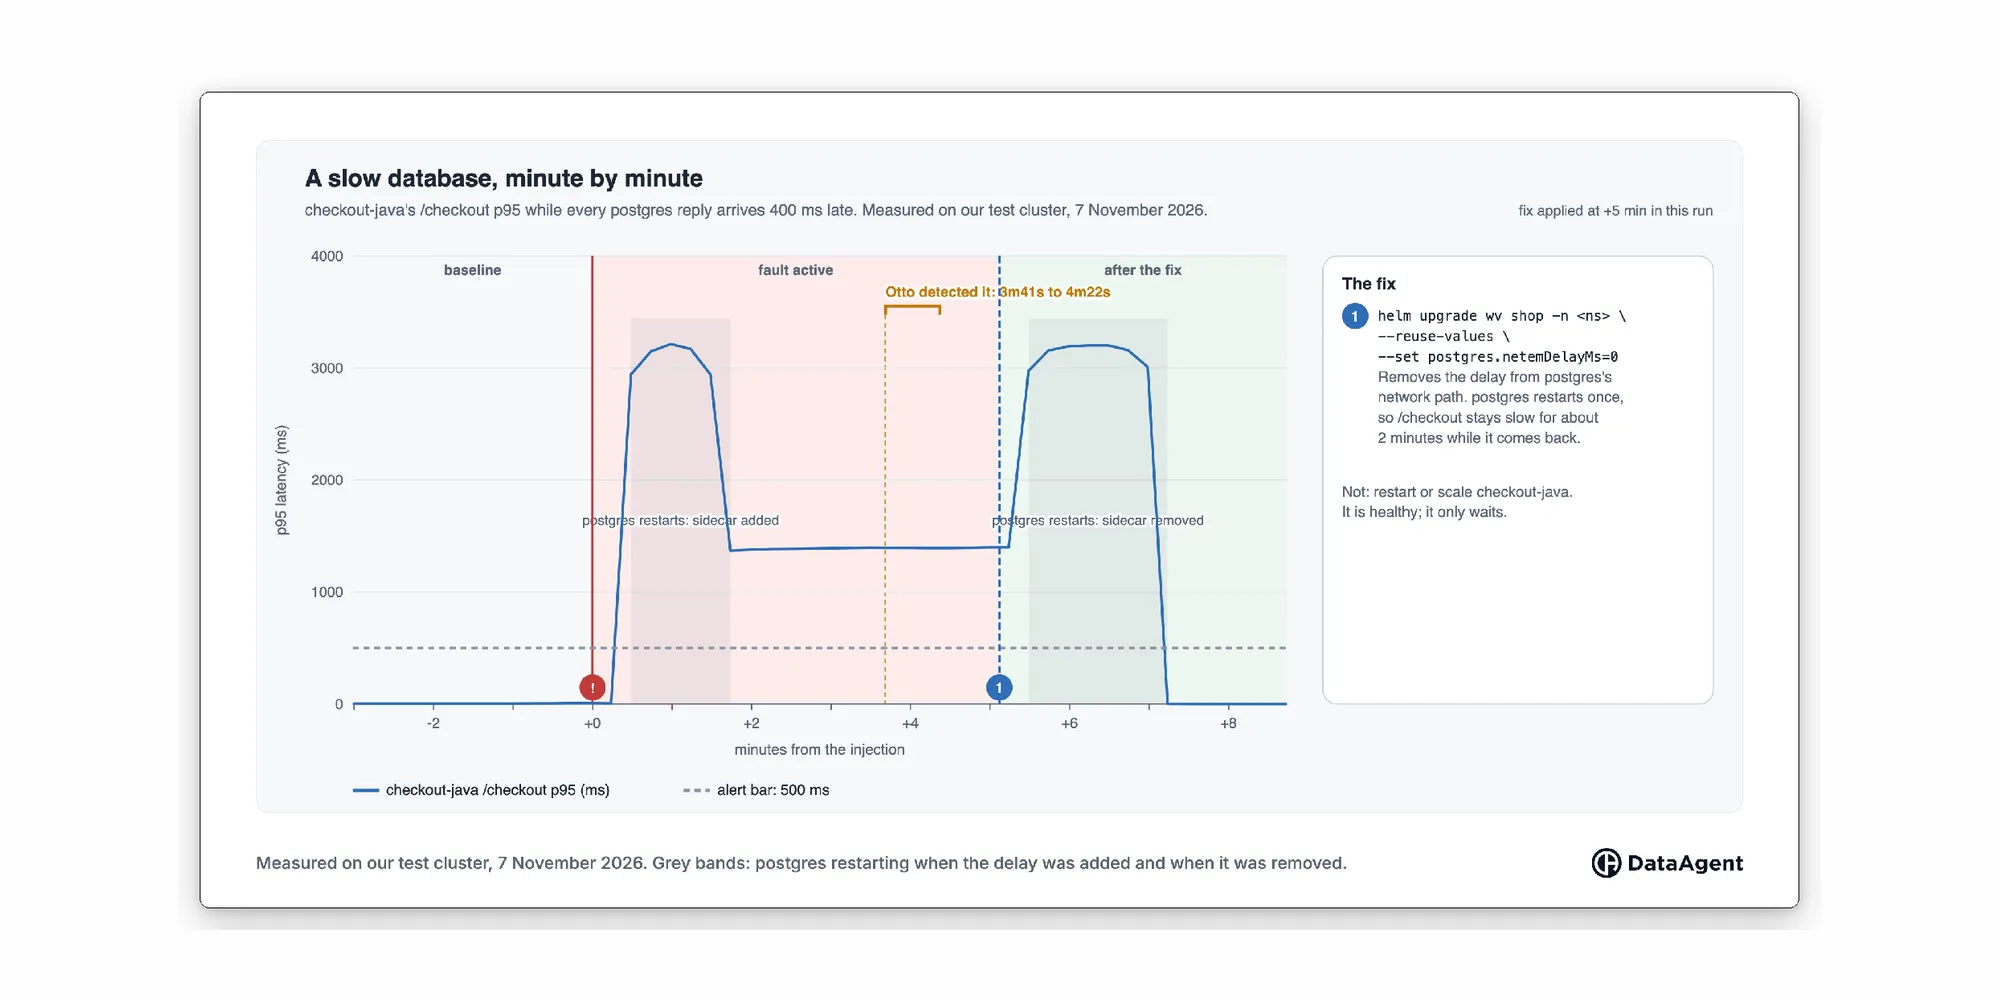
The setup: a Java checkout service, checkout-java, reads and writes a Postgres database on every order. We added 400 milliseconds of delay to every reply Postgres sends, using netem, a standard Linux tool for simulating network delay. Postgres itself stayed healthy. It just answered late.
Now look at what the usual signals said:
- Logs: no errors. Nothing failed. Every query succeeded, slowly.
- Pods: every pod Ready. Kubernetes saw nothing wrong.
- Metrics: the checkout’s p95 latency (the response time of the slowest 5% of requests) jumped from near zero to about 1.4 seconds, well past the 500 ms alert line.
So the alert fired on checkout-java. That is the trap. The metrics told us something was slow. They could not tell us whether it was the network, the data, or the app. In an assisted world, that is fine: a human SRE looks, makes the call, and moves on. An autonomous agent has to make that call itself, and it cannot do it from a latency graph.
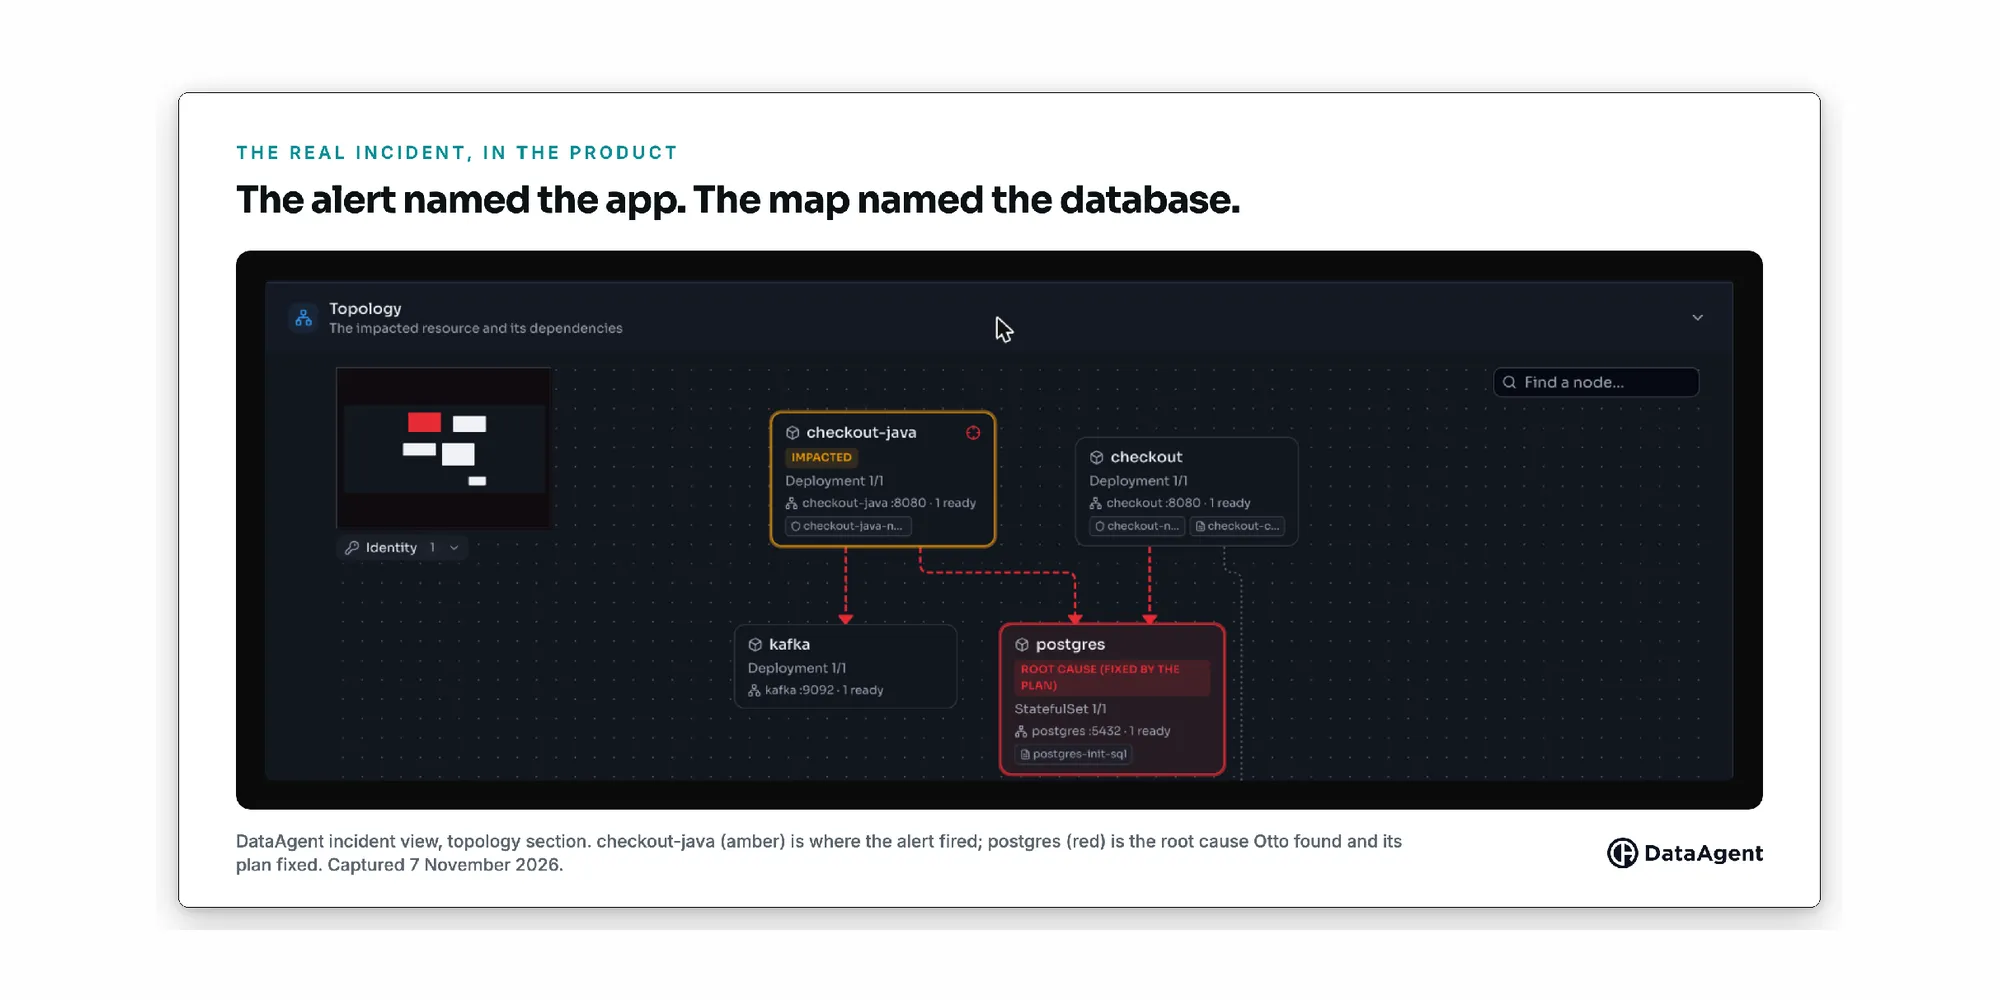
What Otto did differently was follow the wiring. Its topology already held an edge from checkout-java to Postgres, read from the service’s own database setting. Following that edge, Otto checked the dependency instead of the app. It found the extra delay container on the Postgres pod, and saw the time to open a connection from checkout to Postgres jump from about 3 ms to about 400 ms. Its root-cause analysis named the delay on Postgres’s network path, not the app that paged.
The plan matched. Remove the delay at its source. Do not restart or scale checkout-java, because it is healthy and only waiting. Otto detected the fault in under five minutes in every run, and in the three runs we carried through to the fix, its own plan fixed it each time. One detail stood out. Our standard hub fixed it with a single piece of wiring knowledge: that edge from the app to its database. Every other improvement we tested helped, but none was required.
Why a crash detector misses it
K8sGPT, the CNCF project many of you already run, is very good at telling you what is broken: a pod in CrashLoopBackOff, an image that will not pull, a pod stuck in Pending. This incident breaks none of that. Nothing crashes, nothing restarts, nothing is Pending. The cluster looks healthy while the business is slow.
Real systems degrade like this long before anything breaks: a dependency gets slow, memory leaks a little at a time, a config change quietly makes things worse. That gap is why this week we released an open-source detection pack that extends K8sGPT to catch early warning signs, together with DataAgent Lab, a free workshop for building an autonomous SRE on your own laptop. We extended K8sGPT rather than start yet another project, so everyone who runs it benefits.
The same pattern shows up with bigger stakes on GPU training clusters, where one slow storage server can stall every GPU in a job while Kubernetes reports every pod Ready. On that version of the fault, metrics alone produced 0 fixing plans in 13 attempts. With the wiring and a change record, a smaller model went 6 for 6, scored in our replay simulator. We follow it end to end in our next post: One Slow Disk, Every GPU Waits.
Three quarters of the answer is not on the bill
This is where the observability model breaks. It rests on one assumption: the more data you collect, the more logs, the more metrics, kept for longer, the better you understand your system and the better you fix it. That is the driving-history argument again. Collect every trip of every driver, so you can learn to stop at red lights.
When we weighed the evidence our agent’s root-cause analysis relies on, the split came out roughly 75 to 25. This split comes from the incidents we ran in our test clusters, where we traced which evidence each correct root-cause analysis actually used. Read it as a direction, not a benchmark. About 75% of the weight is deep knowledge of the Kubernetes environment: the topology, configuration changes, Kubernetes state and events, and how the platform’s own moving parts behave. How the Horizontal Pod Autoscaler (Kubernetes’ built-in scaler) and KEDA (an event-driven scaler) add and remove pods. How a service mesh reroutes traffic. When a node disappearing is a routine spot instance reclaim and when it is a fault. Only about 25% is logs and metrics, and mostly from the last few hours, to spot what moved.
If you run clusters, you know why. The same event means different things depending on the state around it:
- An autoscaler taking a service from 3 to 12 pods at 9 a.m. is load. The same scale-out at 3 a.m. with flat traffic is a signal.
- KEDA scaling a queue consumer to zero is normal when the queue is empty. Zero consumers with a full queue is an incident.
- A node vanishing two minutes after a spot interruption notice is routine. A node vanishing with no notice is not.
- A service mesh retrying a failing backend can keep the front end green while every request gets slower.
None of these answers is in a year of log history. All of them are in the cluster’s current state, if the agent knows how to read it.
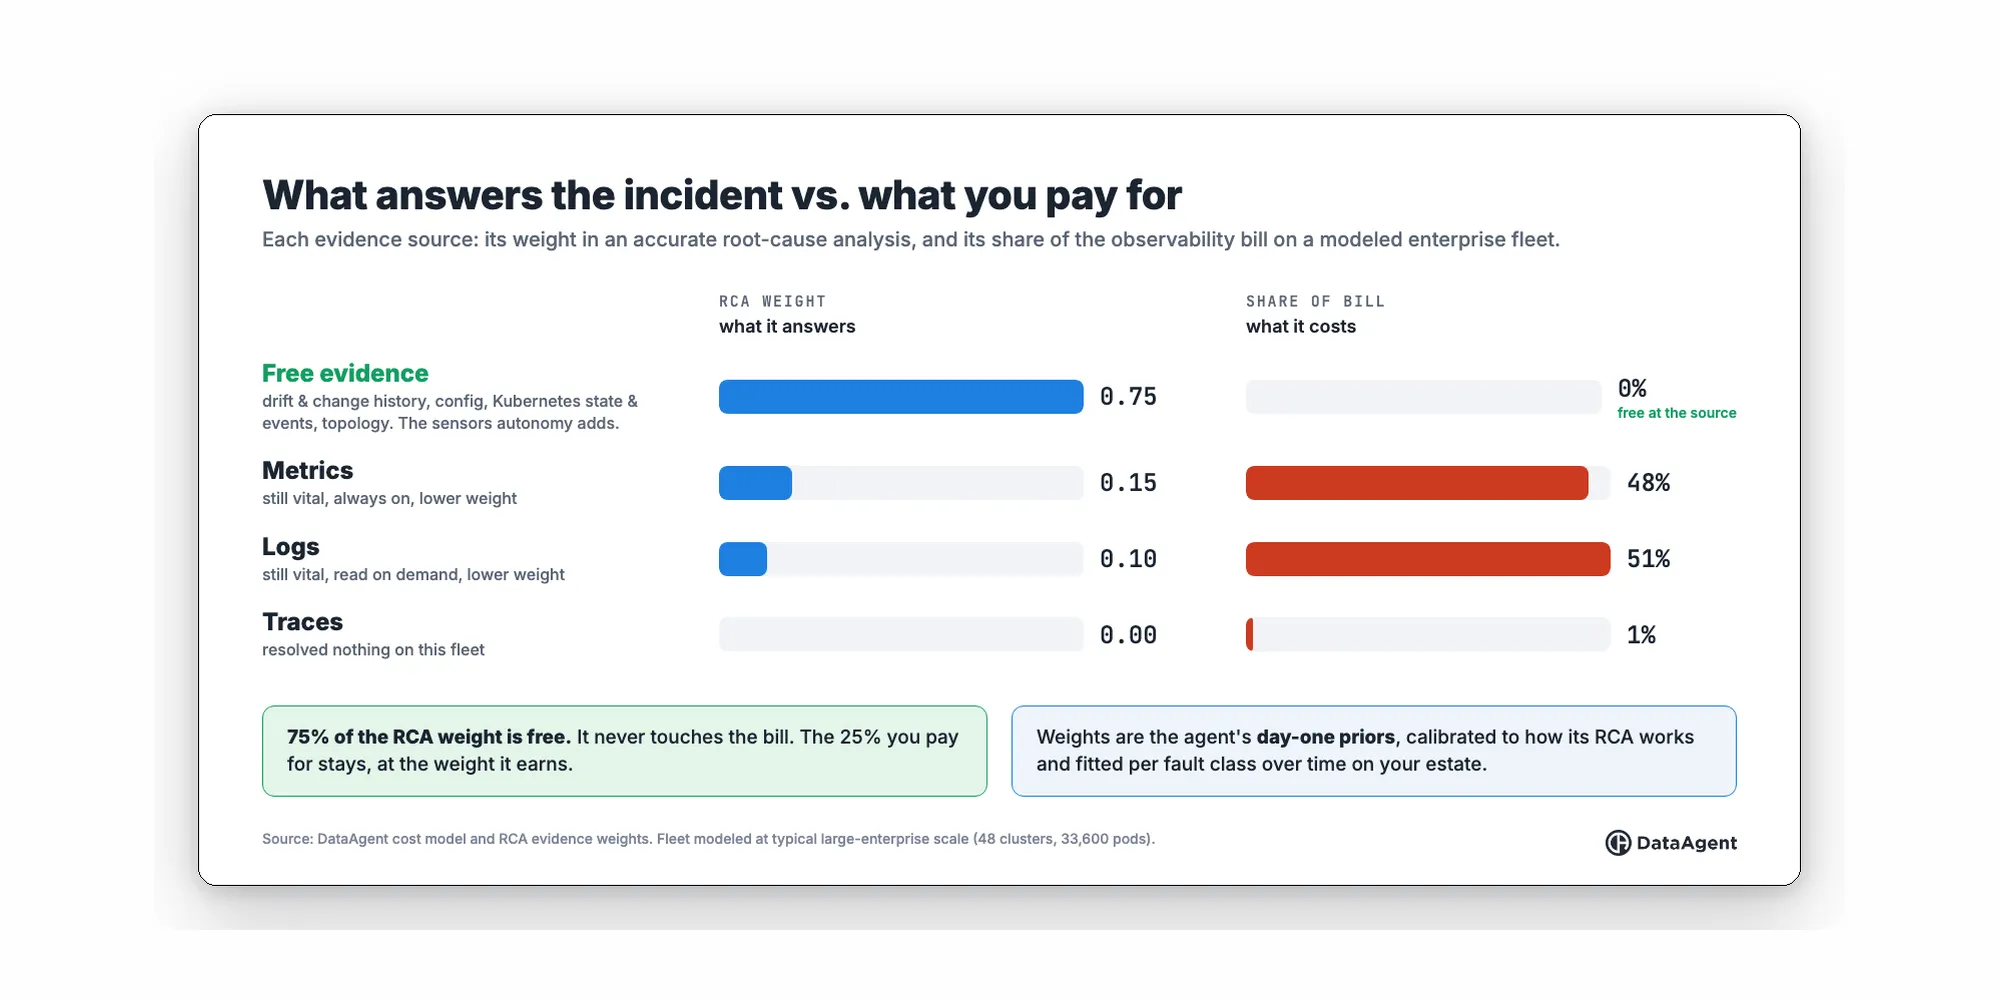
Now put that next to the bill. Metrics and logs are about half the bill each. The evidence that carries three quarters of the answer costs nothing to read, because it already lives in your cluster. What you pay for is almost exactly the inverse of what fixes the incident. That is not a pricing problem a discount can solve. It is a market failure: an industry built to sell storage of the past to people who need understanding of the present. The full cost case is in what observability really costs and the simulator, not the archive.
None of this means turning metrics and logs off. They are how an agent notices the fever in the first place, and the golden signals still frame every incident. It means they are one input among several, needed fresh, not forever.
The question to ask your next vendor
So the next time you evaluate an autonomous SRE, and the pitch leads with how many systems it connects to or how many years of history it keeps, ask something else. Show me how your agent knows what my checkout service depends on. Show me what it does when the alert names the wrong service. Show me the plan it writes when every pod is Ready and every log is clean.
A car does not drive better because it has read every trip ever taken. It drives better because it sees the road. Breadth buys you more of the same market failure. Depth buys you the fix.
At KubeCon this week? See this slow-database incident live at booth 268, at KubeCon + CloudNativeCon North America in Salt Lake City, November 9 to 12.
Want to try it yourself? The free, open-source DataAgent Lab runs on your laptop with K8sGPT and the detection pack. You build an autonomous SRE agent, break a local Kubernetes cluster on purpose with the same kind of silent failure (a slow memory leak, a bad config change), and see what it catches that your dashboards miss. More at data-agent.co/community.
References
DataAgent
- What observability really costs
- The simulator, not the archive
- Ship the agent to the data
- One Slow Disk, Every GPU Waits: Remediation First for GPU Clusters
- DataAgent Lab on GitHub and the community page
K8sGPT and KubeCon
- K8sGPT and its CNCF project page
- KubeCon + CloudNativeCon North America 2026, Salt Lake City, November 9 to 12
AI models and long context
- Context Rot: How Increasing Input Tokens Impacts LLM Performance, Chroma, July 2025
- Lost in the Middle: How Language Models Use Long Contexts, Liu et al., 2023
Kubernetes, Linux and SRE practice
- Horizontal Pod Autoscaling, Kubernetes documentation
- KEDA, Kubernetes event-driven autoscaling
- Spot Instance interruptions, AWS documentation
- tc-netem(8), network emulation, Linux manual
- Monitoring Distributed Systems: the four golden signals, Google SRE book
Self-driving
- #Autonomous SRE
- #AI SRE
- #Root Cause Analysis
- #Kubernetes
- #Kubernetes Topology
- #K8sGPT
- #KubeCon
See remediation-first in your own stack
Install an agent and watch DataAgent map your topology. No credentials, no commitment.
Keep reading
 Engineering9 min
One Slow Disk, Every GPU Waits: Remediation First for GPU Clusters
On a GPU training cluster, one slow disk stalls every GPU while Kubernetes reports Ready. Three faults from our lab, what our agent got wrong on each, and what it took to fix them.
Nati Shalom • Nov 9, 2026 Engineering13 min
Jev Named the Layer. Now Somebody Has to Measure It.
A model that only makes decisions is the right idea for autonomous operations. But the number that autonomous action depends on is still unmeasured, by the vendor, by the press, and by the first paper built on it.
Nati Shalom • Nov 1, 2026 Engineering10 min
Nobody Can Tell You What Observability Really Costs
Every observability vendor bills in a different unit. We priced one fixed Kubernetes workload with each vendor's own model to show the real cost, why the cheapest option changes as you grow, and why the curve doesn't scale.
Nati Shalom • Nov 1, 2026