One Slow Disk, Every GPU Waits: Remediation First for GPU Clusters
On a GPU training cluster, one slow disk stalls every GPU while Kubernetes reports Ready. Three faults from our lab, what our agent got wrong on each, and what it took to fix them.
 Nati ShalomCo-founder & CTO
In a GPU training cluster, the most expensive failure never turns anything red. One slow disk, one throttled worker or one worker that cannot be placed, and every GPU in the job waits. Here are three such faults we ran in our lab, what our agent got wrong on each, and what it took to fix them.
Meta trained Llama 3 405B on up to 16,000 GPUs. Over a 54-day stretch of that run, the team counted 419 unexpected interruptions, roughly one every three hours. About 78% came from hardware. But the line in the paper that every GPU operator should frame is a quieter one: "Even a single straggler can slow down thousands of other GPUs." The same paragraph adds that such stragglers are hard to detect.
That is the failure this post is about. Not a crash. A slow component that drags a whole job with it, while every status check says healthy.
AI moved onto Kubernetes. Its operations did not.
Kubernetes is fast becoming where AI runs. The CNCF’s 2025 survey found Kubernetes in production at 82% of container users, and 66% of organizations hosting generative AI models run some or all of their inference on it. Another 44% do not run AI on Kubernetes yet, so the move is still early.
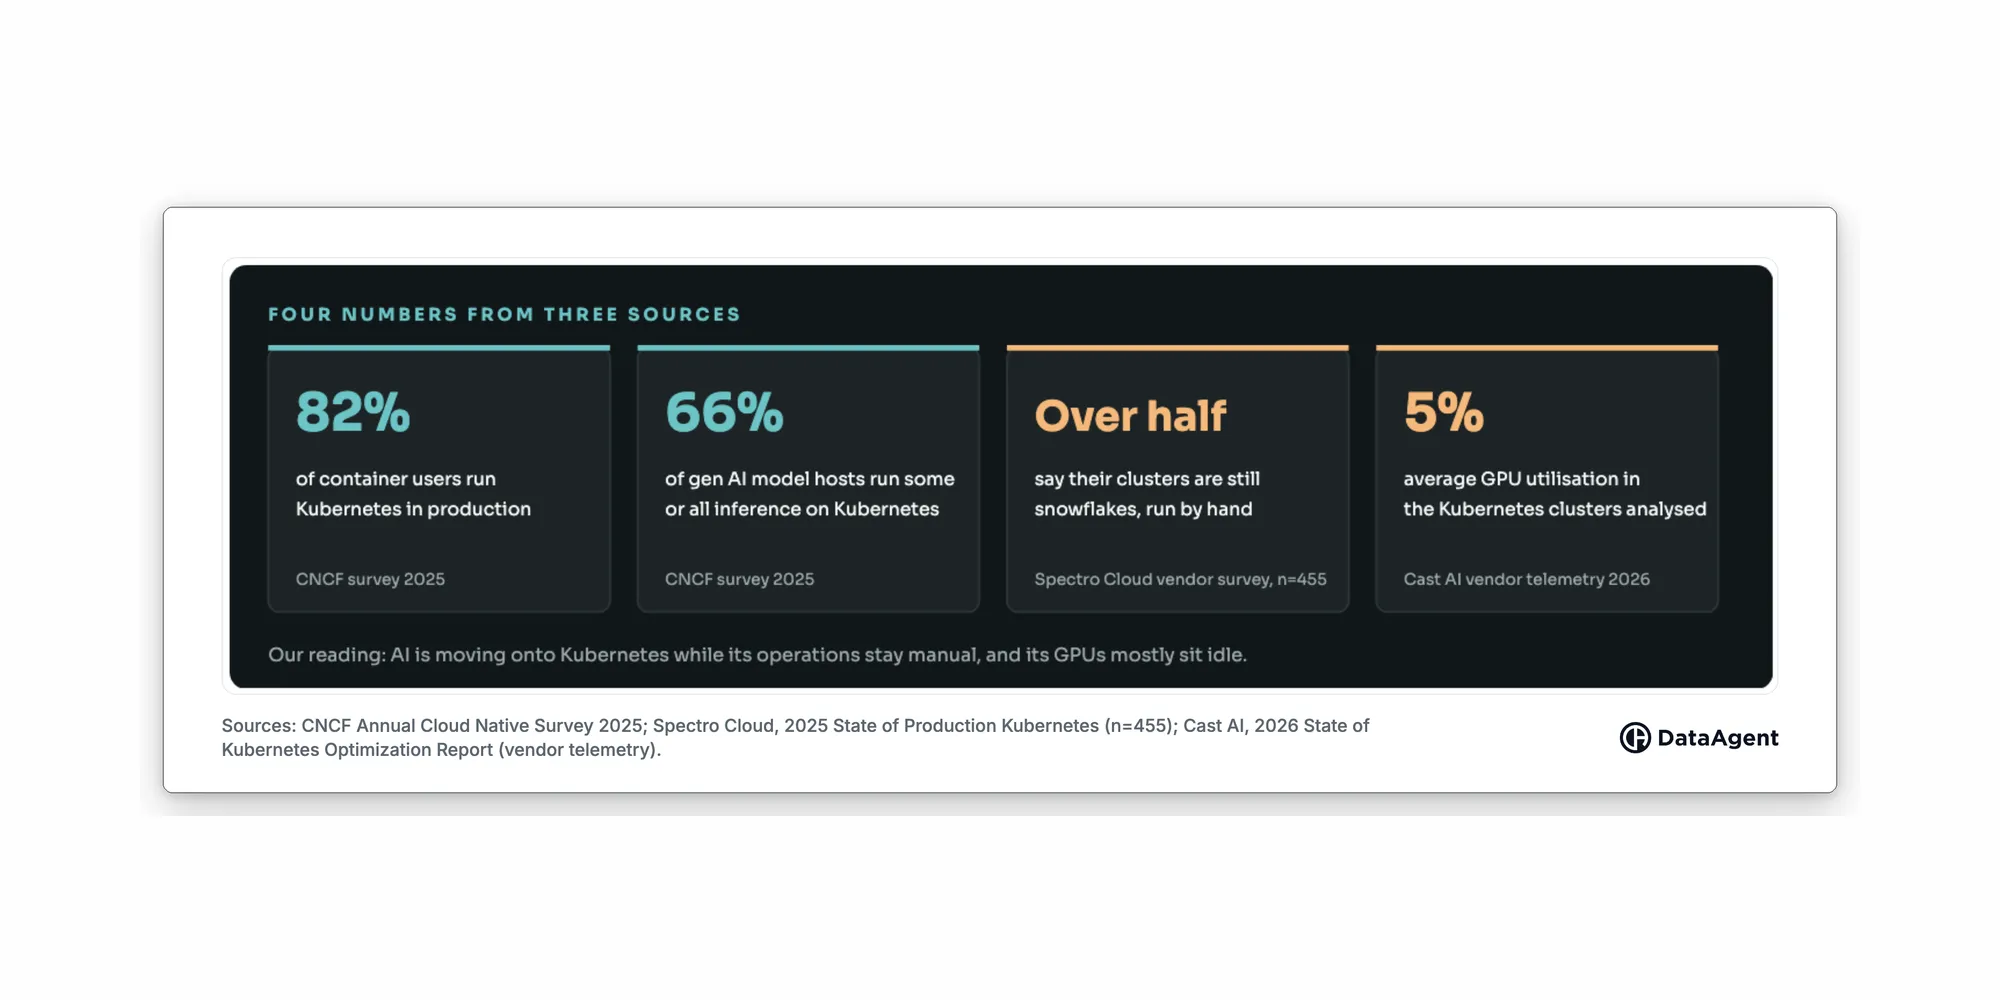
The operations around it have not kept up. In Spectro Cloud’s 2025 survey of 455 platform engineers, over half said their clusters are still "snowflakes" with highly manual operations, and 90% expect their AI workloads on Kubernetes to grow in the next year. Cast AI reports an average GPU utilization of just 5% across the clusters it analyzed. That is one vendor’s data from its own customers, so read it as a direction, not a benchmark.
Meta’s numbers explain why manual will not hold. With an interruption every three hours, the team still reached more than 90% effective training time, because recovery was automated. At that rate a person cannot be the first responder. The question is what the automation has to understand to fix the right thing.
Slow, not down
Synchronous training moves at the pace of its slowest worker. In each step, every worker (a "rank") computes, then all of them exchange results in a step called the all-reduce. If one rank is late, everyone waits.
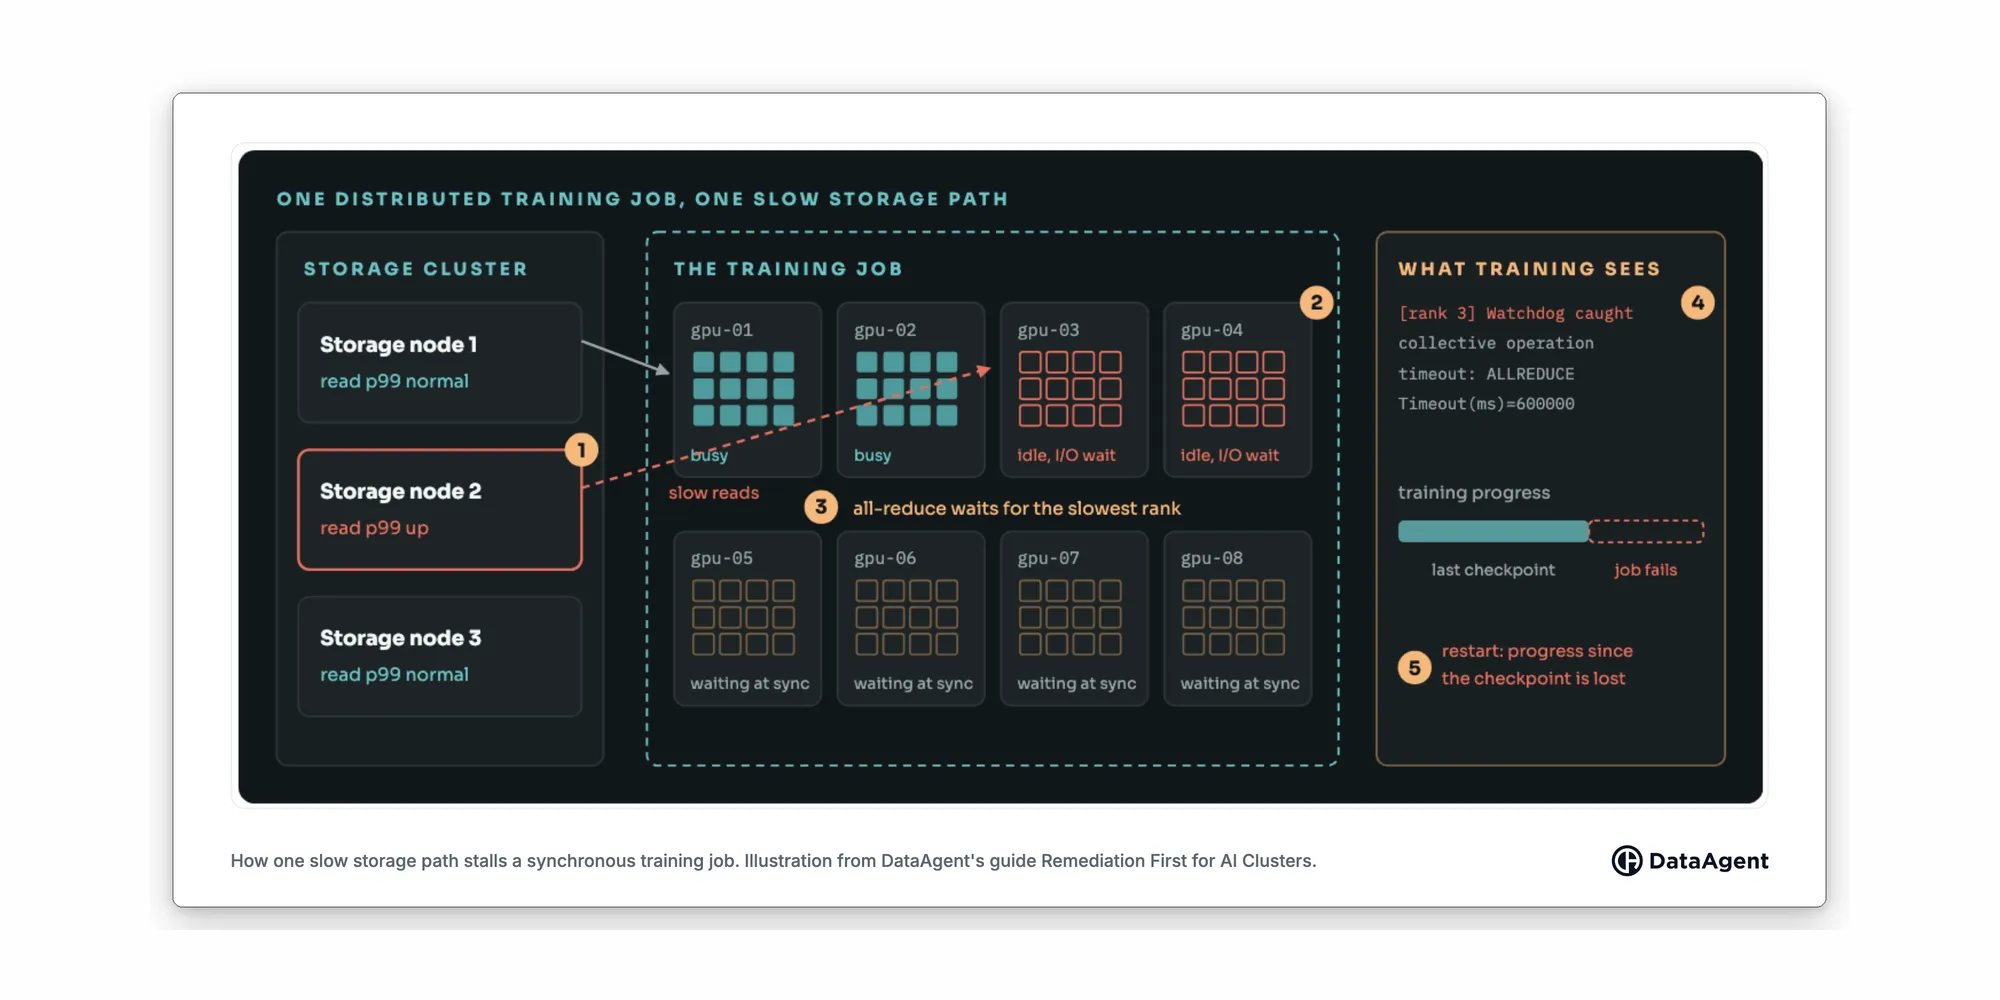
Through the first three steps nothing has failed. Pods are Running, nodes are Ready, GPUs report healthy. The cost shows up as idle GPU hours, not as errors. The signal is in the metrics that show slowness, not in the status that shows failure.
How we built the lab
This work started with a team running a large GPU training cluster. Slow storage had stalled whole training runs, and they wanted those failures fixed automatically, then predicted and prevented.
We built the smallest honest version of their problem. A one-node lab cluster runs a four-rank training job with a real all-reduce. It reads its dataset from real distributed storage, three SeaweedFS storage servers. The scheduler hands out GPUs as a counted resource, the way a GPU device plugin does, while CPUs do the actual math. So the scheduling and storage behavior are real. GPU hardware is not.
Then we picked three faults, three different ways a training job stalls while everything looks Ready:
- A slow storage server. One of the three storage servers answers every request 300 ms late.
- One throttled worker. One rank’s CPU limit is cut in place, from 400m to 150m, while its template still says 400m.
- One worker that cannot be placed. The job is scaled to five ranks on a node with four GPUs, so rank five never starts, and the job’s configuration now expects five.
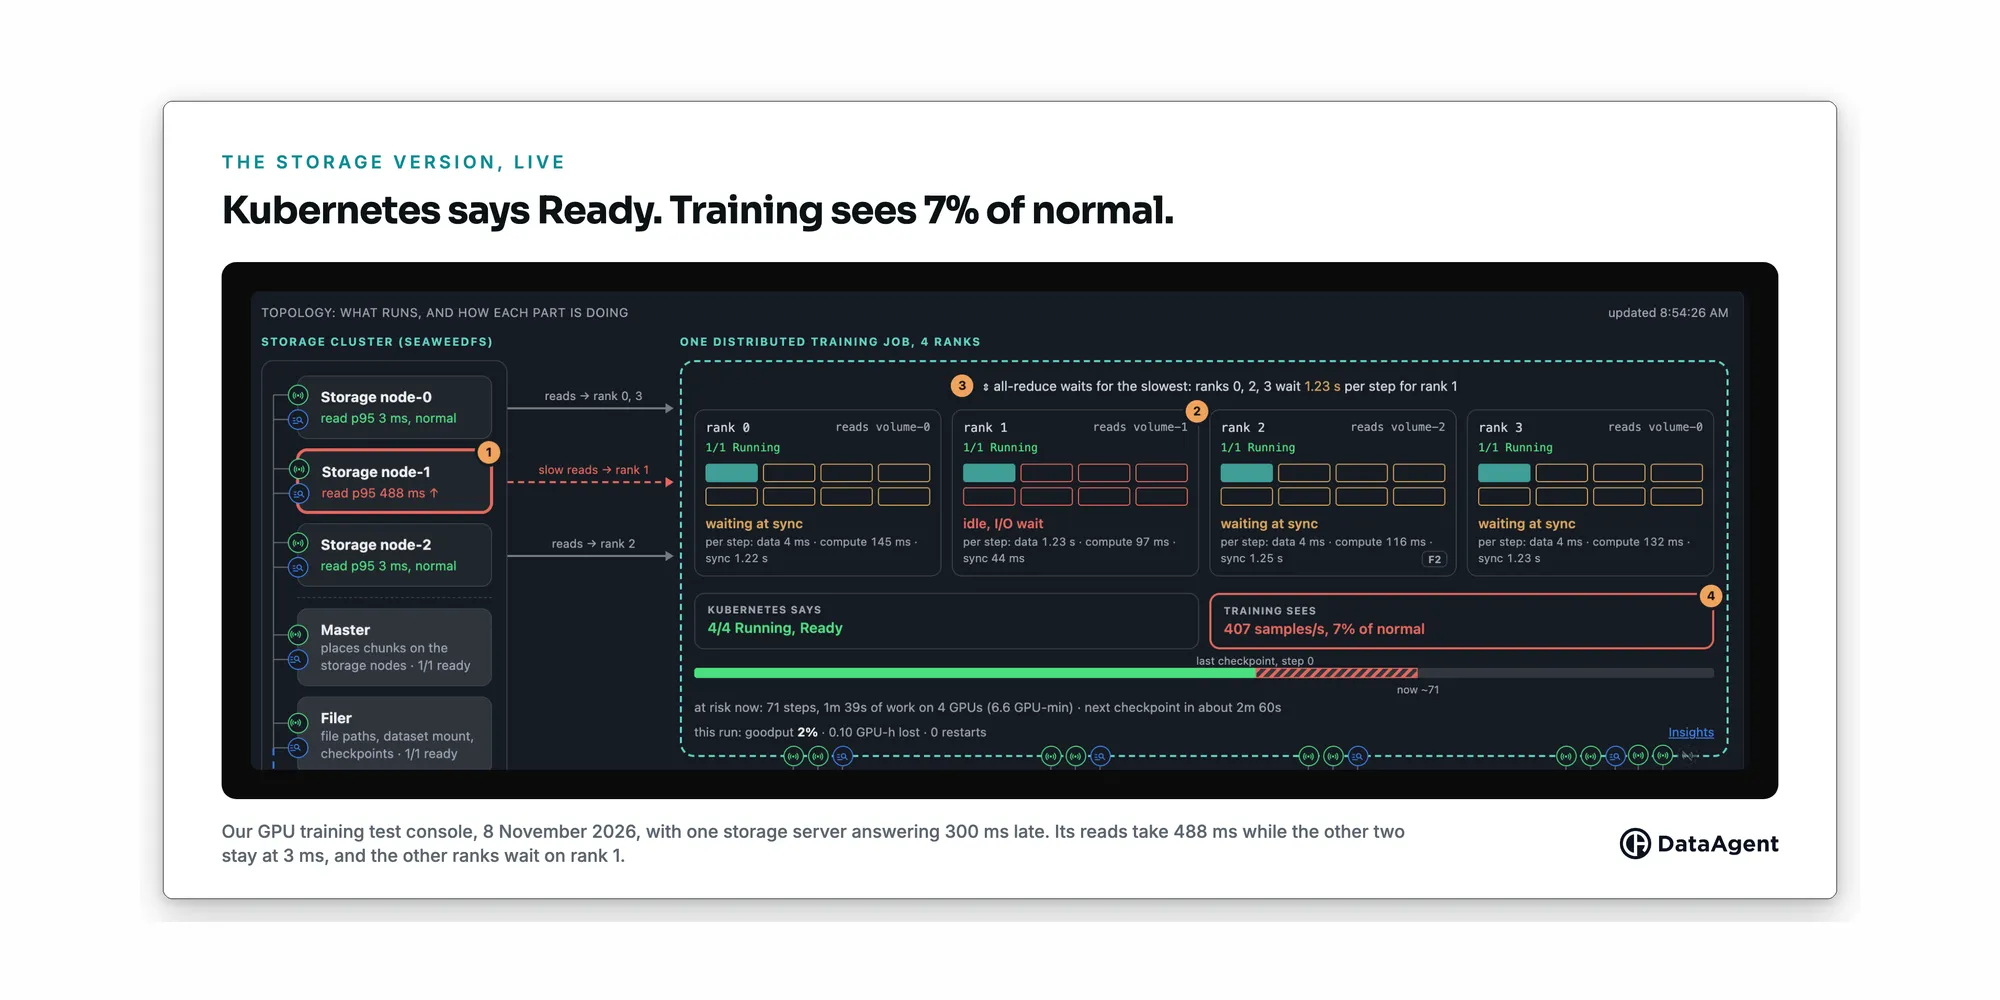
Detection turned out to be the easy part. With only pod health to go on, our agent saw nothing, because pod health never changed. Once the lab exported four golden-signal rules (latency, throughput, errors and saturation, from the training job and the storage client), every fault opened an incident within about three minutes. Otto, our agent, then wrote a root cause and a plan in about a minute.
The hard part was getting the cause right. Each fault taught Otto something different.
Fault 1: the slow storage server
The first analyses blamed the training job: a readiness probe, a missing metric, the rank that was waiting. They reached the slow rank, then stopped one hop short of the storage server behind it. Their plans restarted the rank, which would not help.
We measured it properly. With metrics alone, across 13 attempts on two different AI models, zero plans fixed the fault. Then we found out why. The product drew a wiring map for the screen, but the analysis was not reading it. It had metrics and nothing else, so it could never connect "rank 1 reads slowly" to "rank 1 reads from storage server 1".
So we tested the idea by hand first: give the analysis a correct wiring map and an accurate note of what changed, change nothing else, and sample again. Every plan now went after the storage server. Then we built it for real:
- Links from the metrics. The job’s own metrics name the storage server each rank reads from. That label now becomes an edge in the topology, from the rank to the server.
- What runs inside each pod. The extra container that added the delay is now visible on the storage pod, without a lookup.
- A change record anchored on this incident, not on an older one.
With that depth, the smaller, cheaper model produced six fixing plans out of six, scored in our replay simulator. On the live lab, the full loop took 4 minutes 13 seconds from fault to proposed fix, and once approved, the fix passed verification. We have since added one more line to what the analysis reads, per-dependency latency: "storage server 1 went from 2 ms to 414 ms while its two siblings stayed at 2 ms". It needs only the last three hours of metrics.
Fault 2: one throttled worker
This one Otto got wrong, and it was the most useful result of the week.
The fault opened an incident in under three minutes. The analysis then blamed storage. It saw that the delay container on the storage servers had just been removed, which was our own fix for fault 1, and treated that as the newest suspect. Its plan put the delay back. We declined it.
What was really true: one rank ran with a 150m CPU limit while its template said 400m. That rank computed slowly, and the other three waited on it. Its storage reads even looked slow, at 67 ms, because it timed each read on a starved CPU. Two lessons came out of it:
- A fix is not a suspect. A remediation’s own change should never be read as the newest cause.
- Compare each pod with its template. If one pod’s limits differ from the rest, it was changed in place, and the fix is that pod, not the whole workload.
The second lesson became a rule in the planner. We tested it on a non-GPU version of the fault: one web service pod resized in place. Without the rule, the plan re-applied the Deployment’s limits. That changes nothing, because the template was already right. With the rule, the plan replaced the drifted pod and the fault was fixed, in every run since.
Fault 3: one worker that cannot be placed
Here the diagnosis was right, and the first fix was not enough.
The rank that could not be placed opened an incident in about two minutes. Otto’s plan scaled the job back from five ranks to four. It missed the second half of the fault: the job’s configuration still told every rank to expect five peers. Scaling back unblocked a rolling update that had been waiting, the four running ranks restarted with the new configuration, and every one of them started waiting for a fifth rank that would never exist. The whole job stalled.
Every pod stayed Ready the whole time. What saved the run was verification. Our pipeline does not mark an incident fixed because pods are Ready. It checks the job’s own health. Fifteen minutes later that check still read broken, so it sent the incident back for a new analysis, with the failure as context. The second plan set the expected rank count back to four, and the job recovered.
Ready is not fixed. On a training cluster, fixed means step time and throughput are back to the job’s own normal.
This fault is also not really about GPUs. It is any group whose members need each other: training ranks, a quorum, a database that commits to a synchronous replica. So we built the general version: a database replica that cannot be scheduled, which makes every write on the primary hang while reads and readiness look fine. It taught the planner one more rule. In Kubernetes, fixing a StatefulSet’s template does not fix the pod already stuck on the old version, so the next step deletes that pod by name. That rule has held in three of four runs so far.
What remediation first means on a GPU cluster
The three faults point to the same design. Fix first, before anyone opens a dashboard, but fix the right thing and prove it.
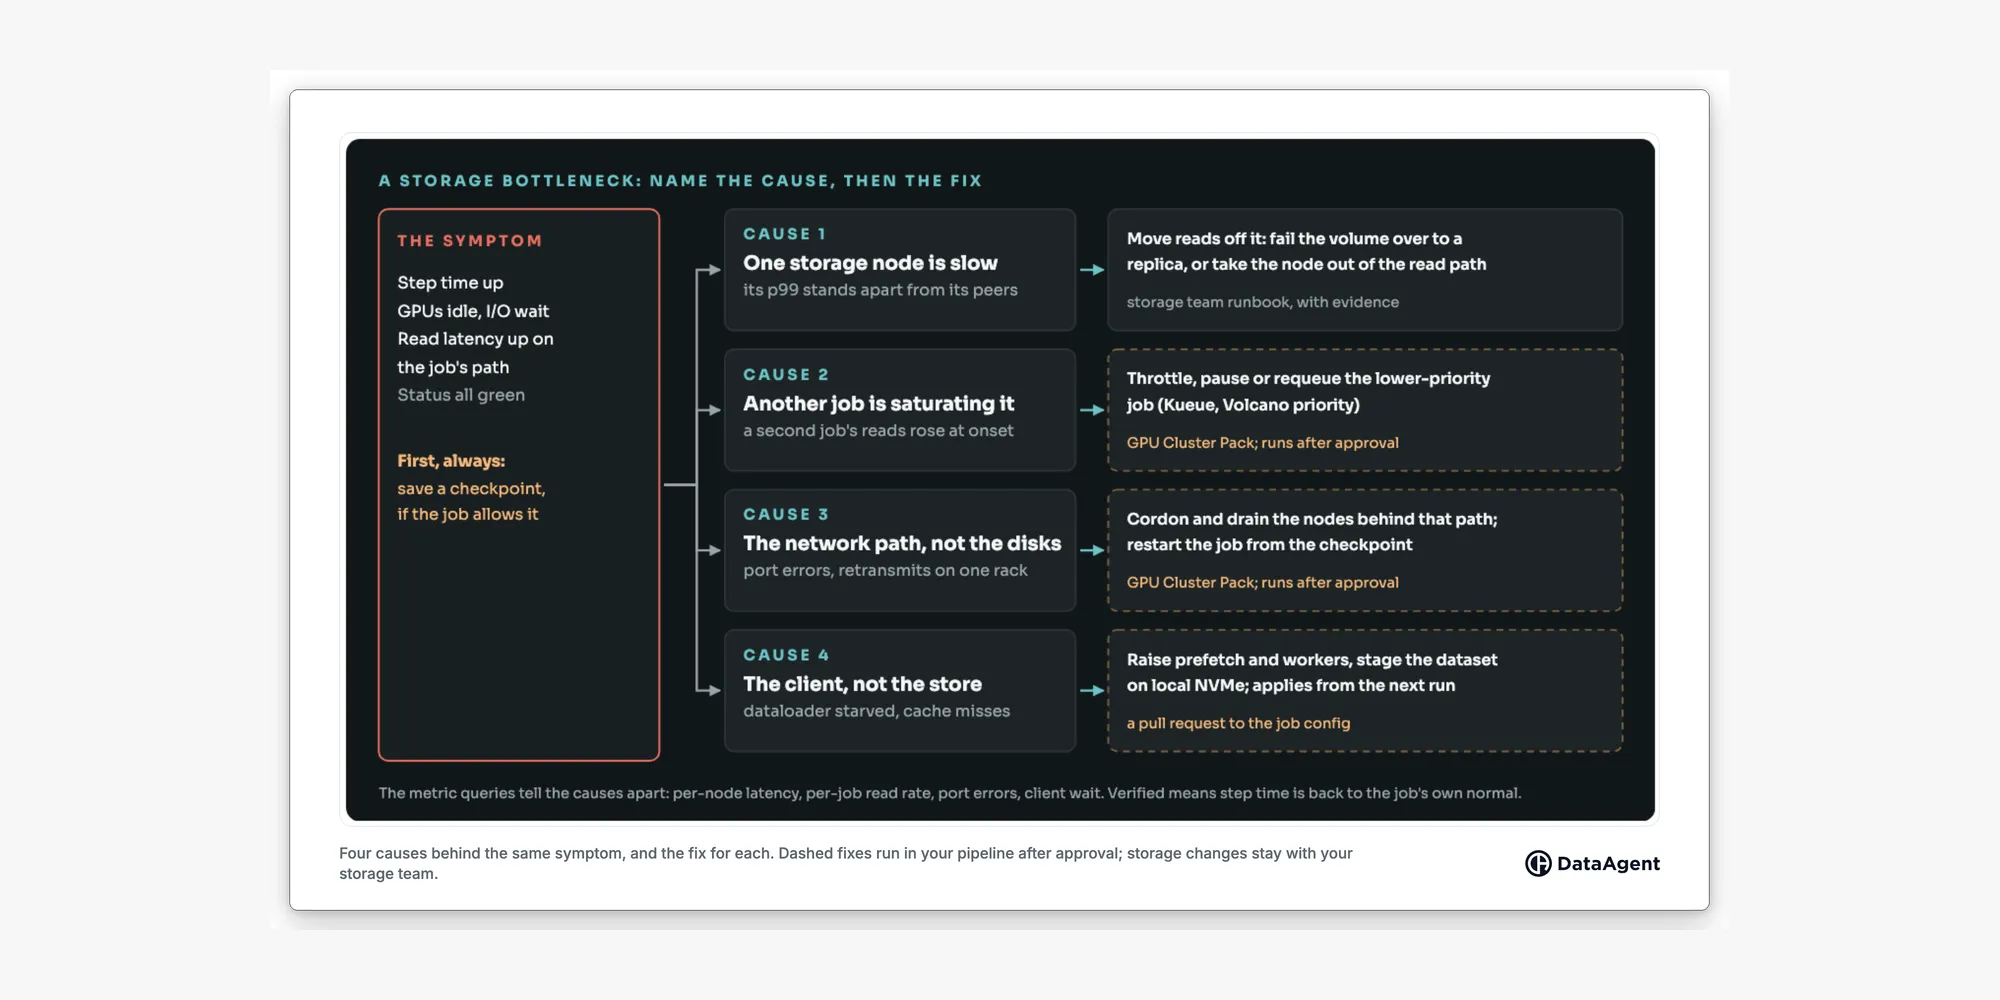
- Save the run first. If the job supports it, the plan takes a checkpoint before any other step.
- Name the cause before the action. A slow node, a competing job, a bad network path and a starved client look the same from the job. The wrong fix costs a restart and leaves the cause in place.
- Verify on the job’s own signals. Step time and throughput back to normal, not an alert that cleared.
- Keep write access where it is. Every change runs in your pipeline, under your credentials, after a person approves it. A fault class earns autonomy one verified fix at a time. Storage administration stays with your storage team: the plan names the step and attaches the evidence.
What this does not prove yet
Our lab uses CPUs as a stand-in for GPUs. The storage faults are real, but nothing here speaks for GPU hardware faults, and we do not simulate GPU errors, because a diagnosis proven on a fake signal proves nothing. The six-of-six result was scored in our replay simulator. The planner rule for stuck replicas held in three of four runs, not all of them. And we have no GPU-cluster customer references yet. The first proof of concept on a real cluster is how one gets earned.
So, is it worth testing on your cluster?
Yes, if a slow storage path has ever cost you a training run. Start from that incident, not from a demo. Replay it on a staging pool, read the diagnosis and the plan, and merge nothing. If the cause is wrong, you learned that cheaply. If it is right, let one fix run end to end: a checkpoint saved, the cause removed, step time back to normal.
One slow disk can make every GPU wait. The fix is not more dashboards on the GPUs. It is an agent that knows which disk each GPU waits on, and fixes that.
At KubeCon in Salt Lake City this week? Come see the lab at booth 268, at KubeCon + CloudNativeCon North America, November 9 to 12. Start with the companion post, When They Go Wide, We Go Deep, and try the free, open-source DataAgent Lab on your laptop.
References
GPU training at scale
- The Llama 3 Herd of Models, Llama Team, AI @ Meta, 2024 (see Table 5)
Kubernetes and AI, market data
- CNCF Annual Cloud Native Survey 2025, announced 20 January 2026
- Spectro Cloud, 2025 State of Production Kubernetes, 4 August 2025
- Cast AI, 2026 State of Kubernetes Optimization Report, 21 April 2026
Tools in the lab
- SeaweedFS, the distributed storage in the lab
- tc-netem(8), the Linux tool that added the storage delay
DataAgent
- #GPU Clusters
- #AI Training
- #Kubernetes
- #Autonomous SRE
- #Autonomous Remediation
- #Stragglers
- #KubeCon
See remediation-first in your own stack
Install an agent and watch DataAgent map your topology. No credentials, no commitment.
Keep reading
 Engineering9 min
When They Go Wide, We Go Deep
Every pod was Ready, every log was clean, and the alert named the wrong service. A real Kubernetes incident, and why an autonomous SRE needs depth, not more integrations, to fix it.
Nati Shalom • Nov 9, 2026 Engineering13 min
Jev Named the Layer. Now Somebody Has to Measure It.
A model that only makes decisions is the right idea for autonomous operations. But the number that autonomous action depends on is still unmeasured, by the vendor, by the press, and by the first paper built on it.
Nati Shalom • Nov 1, 2026 Engineering10 min
Nobody Can Tell You What Observability Really Costs
Every observability vendor bills in a different unit. We priced one fixed Kubernetes workload with each vendor's own model to show the real cost, why the cheapest option changes as you grow, and why the curve doesn't scale.
Nati Shalom • Nov 1, 2026