In short
- Bolted on top of your observability stack, an autonomous SRE inherits every problem that stack already has and makes the bill worse. The problem is architectural, and so is the fix.
- This is right-sizing, not replacement: your engine, dashboards and contract stay, and what changes is what you send, how long it stays hot, and what that costs.
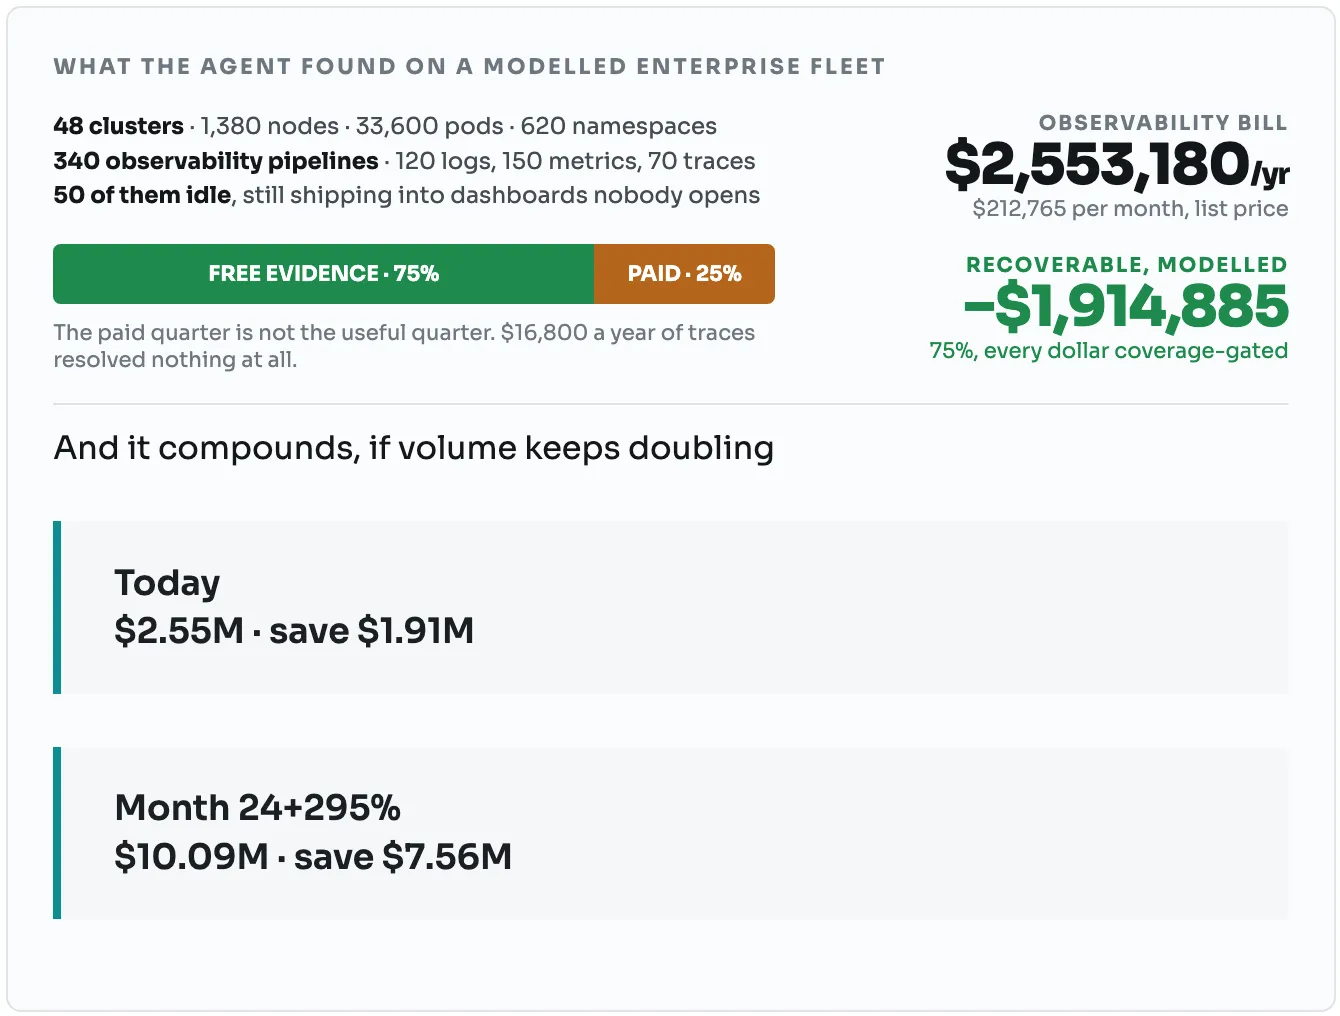
- Three quarters of the evidence an investigation needs is free and already in your cluster. The quarter you pay for carries the least weight in finding a cause.
- Every reduction is coverage-gated, journaled and reversible: a cut is only proposed while the agent can still find that fault without it.
- Each figure is labelled measured, audited or modelled, and costs are list price before credits. The 40 to 65% saving is audited across vendors; 80%+ is modelled.
In this guide
One product, and the part of it this guide pays for
DataAgent is a loop, not a feature. It detects, models what is running and what changed, correlates, reasons to a root cause, decides whether a person must approve the fix, hands the fix to your own pipeline, verifies and learns. This guide is about the data underneath the first two stages, and what that data costs.
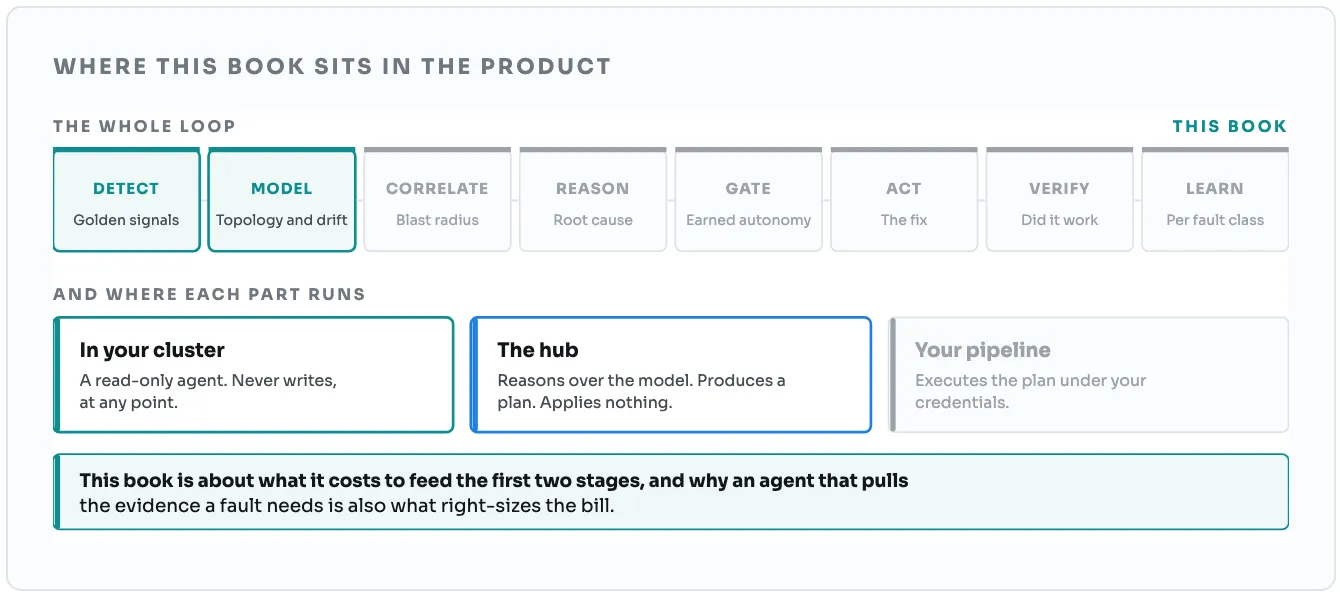
The argument that follows is an architectural one rather than a billing one. An agent reading state and change on demand needs a fraction of what a stack built for a human reader collects continuously, which is why the saving comes from the shape of the system and not from a procurement exercise.
↑ Back to topYou are about to buy an autonomous SRE
Bolted on top of your observability stack, it will inherit every problem that stack already has, and make the bill worse. The problem is architectural, and so is the fix.
The trap in bolting an agent on top
A bolt-on agent can only read what was shipped: metrics, logs and traces. That is the quarter of the evidence that costs essentially the whole bill, and carries the least weight in finding a cause.
The evidence that actually resolves incidents, what changed just before the fault, cluster state and events, live topology, was never shipped to the central store. A bolt-on agent cannot see it.
It is not searching a haystack. It is searching the wrong haystack.
The deepest version is structural. Topology was never shipped to the central store. So a bolt-on agent gets no map: hundreds of alerts from one failing database arrive looking like hundreds of separate problems.
Autonomy makes this worse, not better. An agent that acts needs more evidence than a dashboard did, and if it sits on the central store the only way to give it more is to ship more data. Bolt-on autonomy has a built-in incentive to grow your bill.
The change: move the agent to the data
Observability moved all data to the middle. Otto, our agent, goes the other way. It runs inside each cluster, next to the thing it watches, reading the evidence at the source.
Central data cloud: move the data to the question. Distributed data cloud: move the question to the data. Section 6 works it through.
What that unlocks
Once detection happens at the source, your backend stops being the real-time layer and becomes what it is genuinely excellent at: forensics, search and audit. It gets promoted to the job it was always best at.
From there the pipeline becomes adjustable rather than fixed:
- Rate. How much you send, and how often.
- Retention. How long it stays in an expensive tier.
- Tiering. Real-time stays at the source. Long-term goes to your existing platform. Cold goes to object storage.
- Cardinality. Which label breakdowns are worth indexing at all.
Two ways in, one estate
For people. Ask in plain language and get a chart or report built on the fly, across every store.
For machines. The DataAgent CLI, so Claude or any agent framework can query the whole estate directly. An assistant that pulls raw telemetry to reason burns enormous context and waits on the network. One that asks a scoped question and gets findings back is far faster and cheaper.
When you see something
Most autonomous SRE products ask you to trust them with production before they have delivered anything. This one pays for itself first, read-only, so you can judge it on evidence before it is allowed to change anything.
- Stage 01
Days: The bill
Read-only. Nothing changes. It pays for itself.
- Stage 02
Months: Time to recover
Cause found faster, fixes verified.
- Stage 03
Longer: The quiet pager
For fault classes that have earned it, the loop closes without waking anyone.
Built for people, not for agents
Observability was designed for a human reader. That one fact explains most of what you pay.
Part one: it costs more than you think
Four reasons the number is bigger than the invoice suggests.
- It was built for people. That design decision is most of the cost.
- It compounds. The bill is a multiplication, not a sum.
- It cannot be compared. Every vendor bills in a different unit.
- Most of it buys nothing. Three quarters of what an investigation needs is free.
A person reads it
People cannot watch a live stream. So collect everything. Keep it hot. In case someone looks later. That "in case" is the Data Tax.
An agent reads it
An agent watches the stream as it happens, inside the cluster. Nothing has to be held hot for a reader who arrives afterwards. The backend becomes storage.
Nobody was being wasteful. The mix was set for a reader who might arrive later, and nobody went back to ask what each stream was worth.
When an agent runs the day to day, the main reader of telemetry is the agent, on the live stream. Not a person opening a dashboard afterwards.
The pipeline was shaped around a reader who is leaving the room.↑ Back to top
The bill is a multiplication
Cost was the top observability concern in 2024 and is still in the top three. Here is why it keeps getting worse.
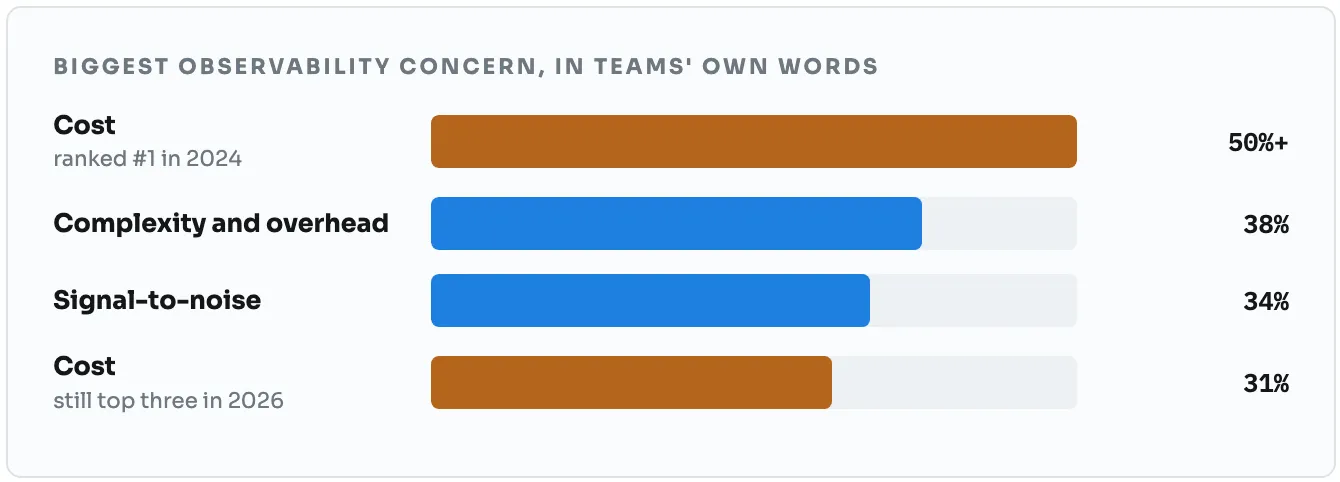
Your bill is not one number. It is several multiplied together: how many services you run, how many copies of each, how many signals each one sends, how many label combinations those carry, and how long you keep it all.
They multiply rather than add. So adding a few services and a couple of labels does not make the bill a little bigger. It puts part of it on a curve.
↑ Back to topNobody can tell you what it really costs
Before you can change a cost you have to measure it. That is harder than it sounds, because no two vendors bill for the same thing.
| Platform | What you pay for |
|---|---|
| Self-hosted open source | Your own servers: storage and compute |
| Managed Prometheus | Metric samples taken in |
| Grafana Cloud | Active series, plus GB for logs and traces |
| Elastic | Cluster size: memory and storage |
| Datadog | Hosts, plus custom metrics, plus GB of logs |
| Node-priced platforms | Kubernetes nodes only, not data volume |
You cannot put these side by side. "$30 per node" and "$6.50 per thousand series" are not the same kind of number.
A vendor can look cheap by pointing at the unit where its rate is low, and staying quiet about the unit where your data actually piles up.
How to compare them fairly
Pick one workload. Run every vendor's own published prices against it. Take the workload size from independent survey data, not from anyone's price list.
Two corrections do most of the work.
Use the same scrape rate
Some platforms collect metrics every 15 seconds by default. That is four times the data of 60 seconds, so they look four times worse for no real reason. Price everyone at 60 seconds.
Count cloud data the same way
Your cloud sends data about managed services whether you want it or not. Some platforms read it where it sits, which is cheap. Others copy it into their own cloud, so you pay twice. Charge each one for what it really does.
↑ Back to topWhat the bill alone hides
Once every platform is on one yardstick, you can see something an invoice can never show: what each one charges for identical work.
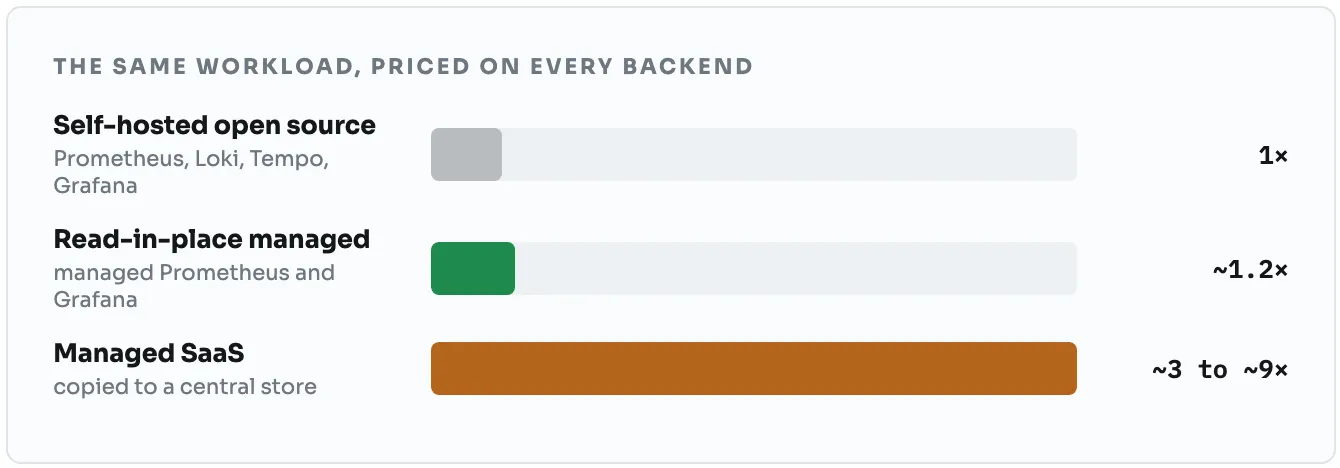
That gap is the premium you pay not to run the stack yourself. For many teams it is a fair trade. Running metrics and logging at scale is real work and somebody has to be on call for it.
It is worth paying on data you actually read. It is much harder to justify on data nobody ever queries.
Right-sizing does not mean leaving your vendor. It means not paying that premium on telemetry you never look at.↑ Back to top
Most of the bill buys nothing
Here is the part that reframes everything. Most of what an investigation actually needs is already free.
| Evidence | Weight | Share of bill |
|---|---|---|
| What changed just before the fault | 0.30 | 0% |
| Cluster state and events | 0.30 | 0% |
| Topology, derived live | 0.15 | 0% |
| Metrics, still vital | 0.15 | 59% |
| Logs, still vital | 0.10 | 39% |
| Traces, no weight as built today | 0.00 | 2% |
Three quarters of the answer costs nothing. It is already in your cluster. You just have to live there to read it.
Metrics and logs stay essential and stay always on. They are how the agent notices the problem at all. They simply carry less weight than their share of the bill.
Read that table honestly
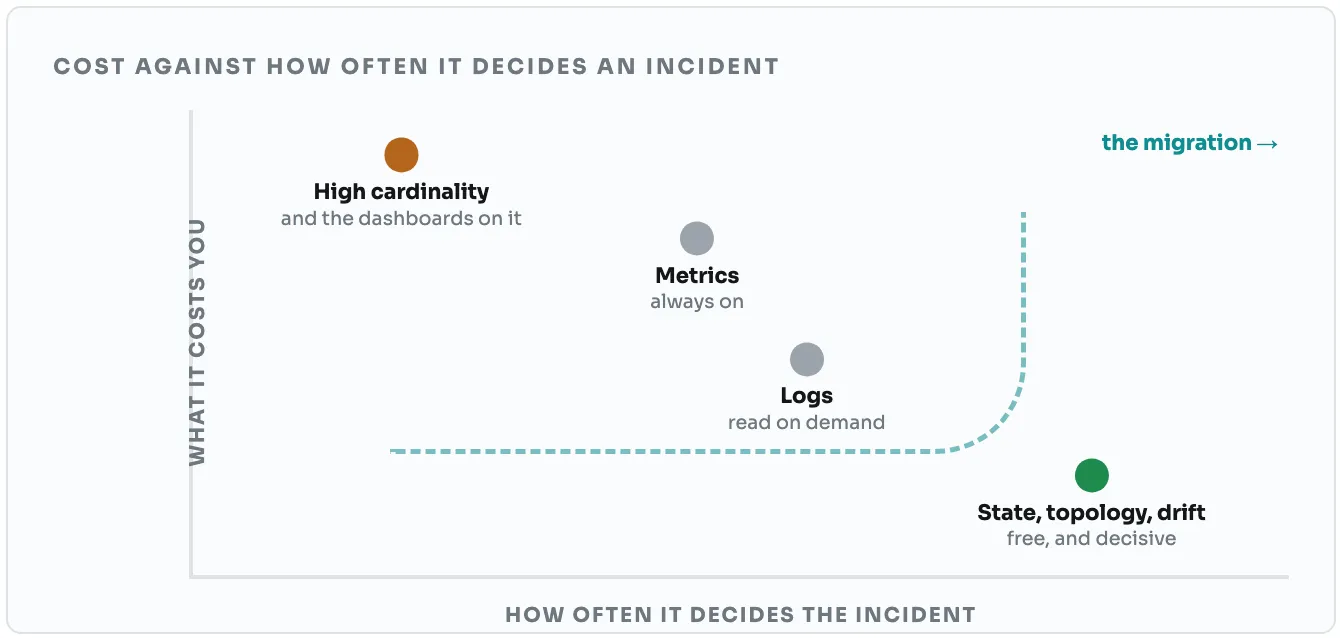
These weights are the agent's starting assumptions, then tuned per fault class against your own estate over time.
Whether metrics or logs lead on your bill depends on your stack. Traces will not be worthless on every fleet. On an estate leaning hard on tracing for latency work, that last row looks different.
What does not change is the shape. The evidence carrying most of the answer is neither metrics nor logs, and it is free.
Most of an observability bill is not buying answers. It is buying the feeling of being covered.↑ Back to top
From central to distributed
For fifteen years the answer to every data problem was the same: move it to the middle. Observability is the purest example.
Part two: the architecture is the opportunity
This is not a cost-cutting exercise. The saving is a side effect of a change in where data lives and who reads it.
- Data stops moving to the middle. It stays where it is produced.
- The AI agent becomes the single interface over all of them.
- Your existing platform keeps the job it is best at: forensics and audit.
- Every change is gated, measured and reversible.
Central data cloud
Move the data to the question. Ship everything to one place. Keep it hot. Query it from a dashboard. One store, one pane of glass, one bill that grows with every service you add.
Distributed data cloud
Move the question to the data. Data stays where it was produced. The agent reads it in place. Many stores, one agent over all of them, and no hot copy in the middle.
Centralising worked because people cannot be everywhere. One screen, one place to look, so the data had to come to the screen.
An agent can be everywhere. It runs inside each cluster, next to the thing it is watching.
This is the whole change. Not a cheaper central store. No central store in the live path at all.
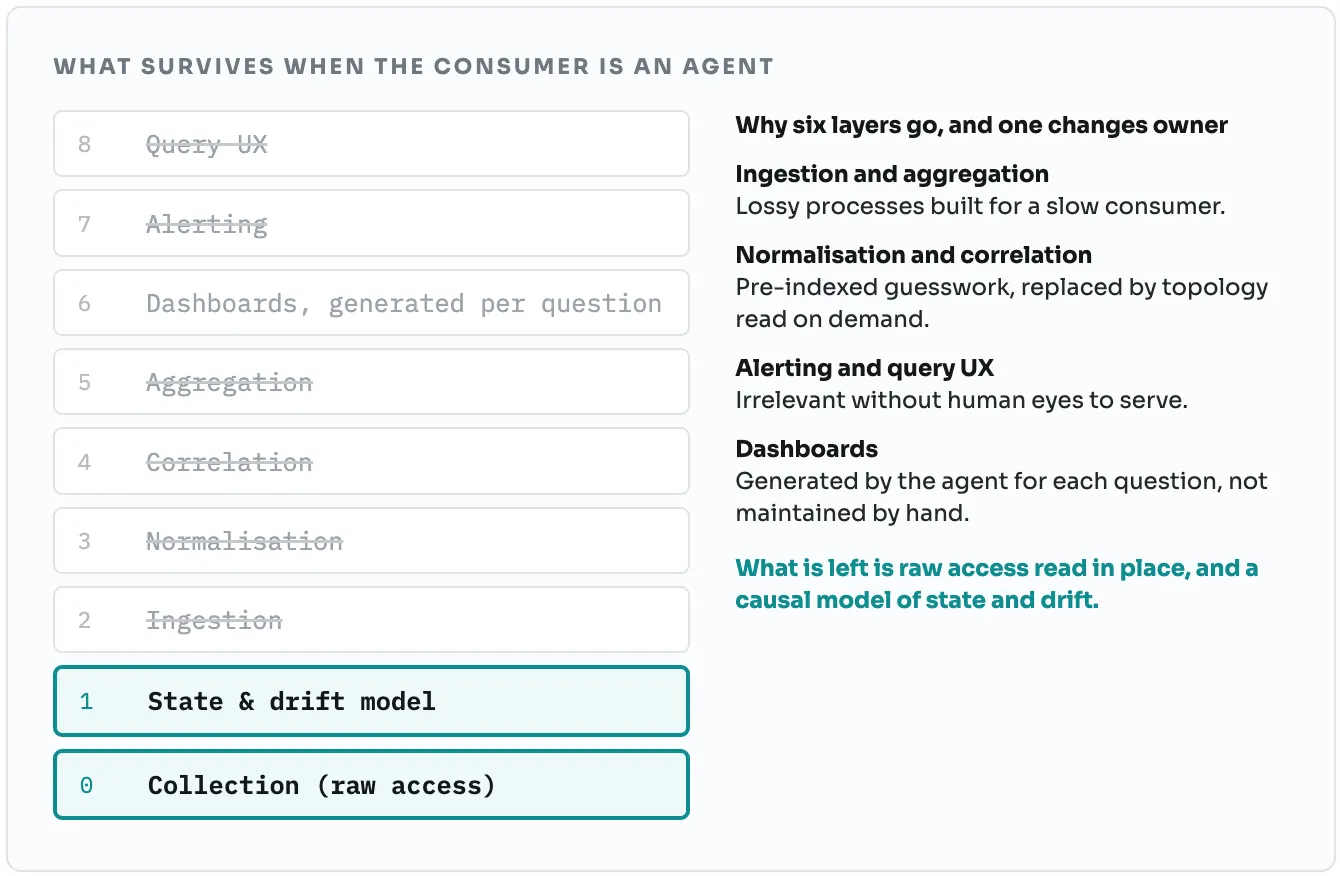
Seven layers existed because a person read the output
Ingestion, normalisation, correlation, aggregation, dashboards, alerting, a query language. Every one existed to turn raw signal into something a person could scan at 2am.
An agent does not scan. It queries exactly what its next decision needs, and reads the raw thing in place.
↑ Back to topStructure first, signals second
Before any telemetry is read, the agent builds a model of your application: what runs where, what talks to what, and which resources are shared.
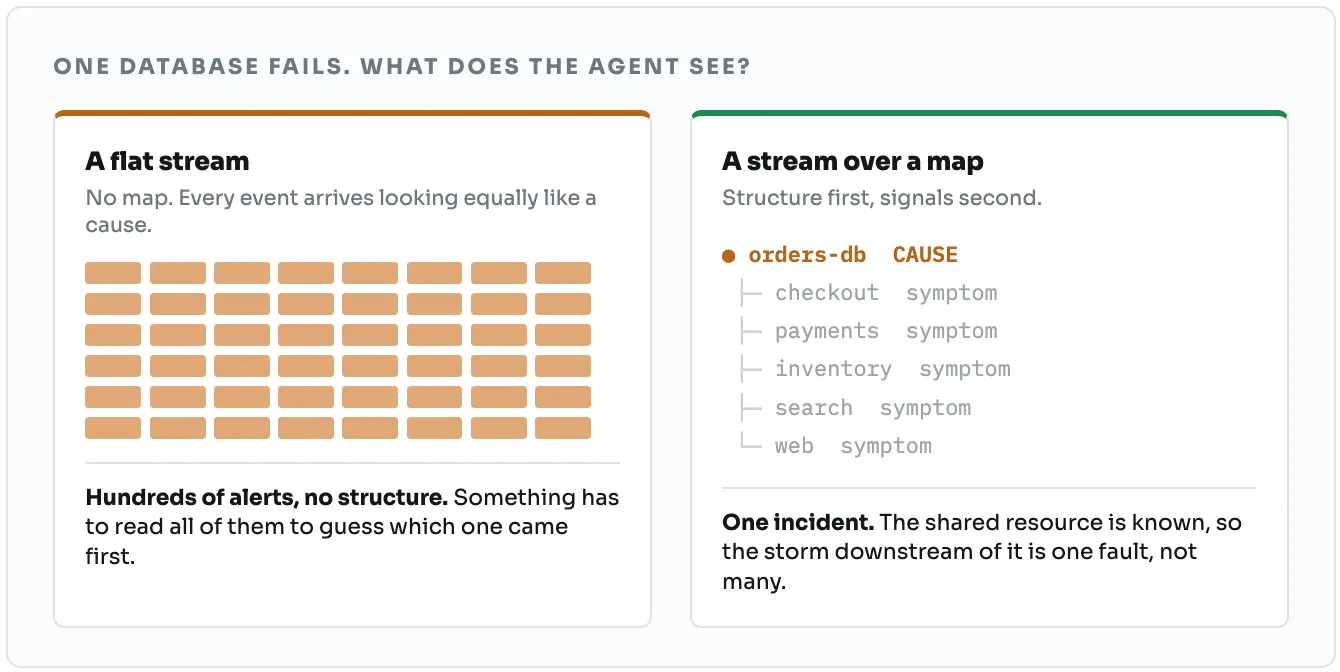
Everything else layers on top of that model. It is the order that matters, and it is the opposite of how most tooling works.
Telling a symptom from a cause is not a reasoning problem. It is a structure problem, and structure is cheap.
Why the order changes the answer
To an agent holding a topology model, a failing database is one problem with a known blast radius. The shared resource is marked as shared, so the storm downstream collapses into one incident: one cause, a list of symptoms.
What this buys, concretely
- Noise collapses. Correlated events fold into one incident per fault, instead of one per affected service.
- Root cause gets faster and more accurate, because the candidate set is the blast radius rather than the whole estate.
- It costs dramatically fewer tokens. The agent reasons over one cause and its radius, not hundreds of duplicate events. That is the difference between an investigation you can afford on every incident and one you cannot.
- Cuts become safe. You can only know which signals a fault class needs if you know the structure that fault travels through.
The agent replaces the single pane
The obvious objection to spreading data out is that engineers now have many places to look. In practice they have one.
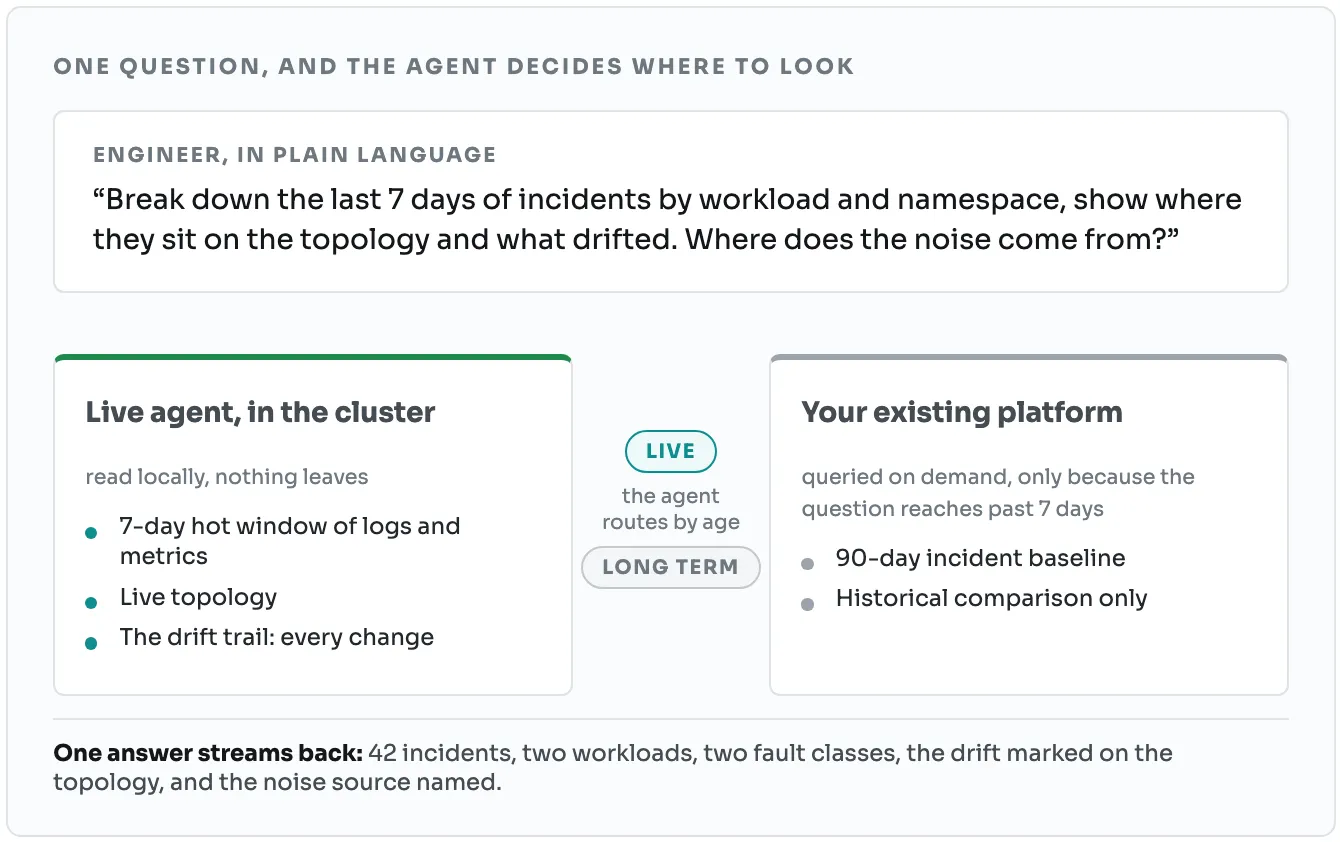
You ask a question in plain language. The agent decides where to look and goes and gets it.
Recent and local? It reads the live window inside the cluster. Older than that? It reaches into long-term storage, and only because the question needs it.
Ingestion, not storage
This decides which levers actually work. Most cost advice targets the wrong one.
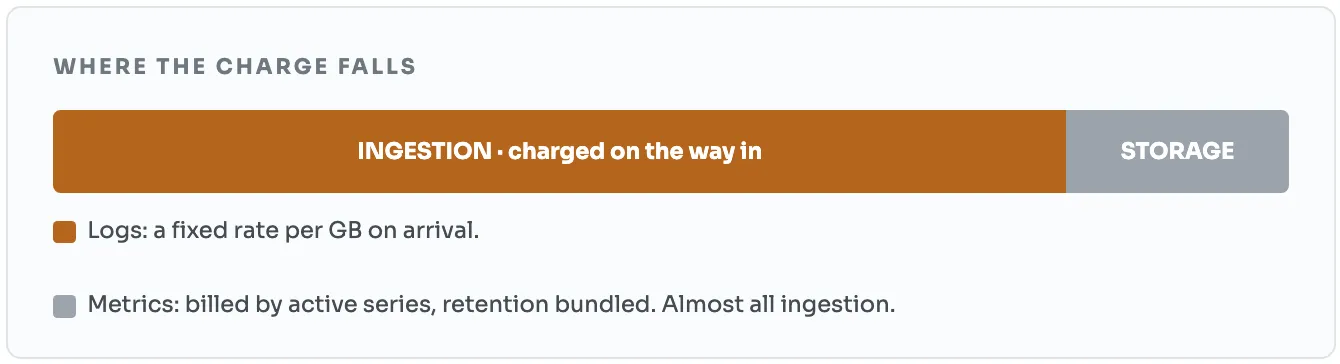
The intuitive move is to shorten retention. On most platforms that deletes your data and barely moves the bill.
Stopping ingestion at the source moves the bill and keeps your data.
Several vendors offer tools that prune unused series. Keep running them. But they act after the data has arrived, so they cannot stop a charge you already paid. And they see one vendor, so they cannot see the same telemetry billed two or three times across your estate.
↑ Back to topEach one native, each one gated
Every lever drives a policy your cloud already provides, so your data stays under its own durability and service level.
| Policy | What it changes | Cut | Reversibility |
|---|---|---|---|
| log-ingest-stop | Turn off noisy control-plane logs, keep audit | ~70% | config-reversible |
| source-reroute | Send routine logs to cheap storage at the source | ~90% | forward-only |
| cardinality | Drop alerting-only series above the baseline | 30–50% | forward-only |
| scrape-interval | Sample every 60s instead of 15s | ~4× | config-reversible |
| hot-tier-demote | Hot search to warm or cold | 50–85% | config-reversible |
| rca-led backup | Firehose becomes a backup, flushed on incident | ~80% | config-reversible |
| retention | Expire stale log groups | storage | destructive |
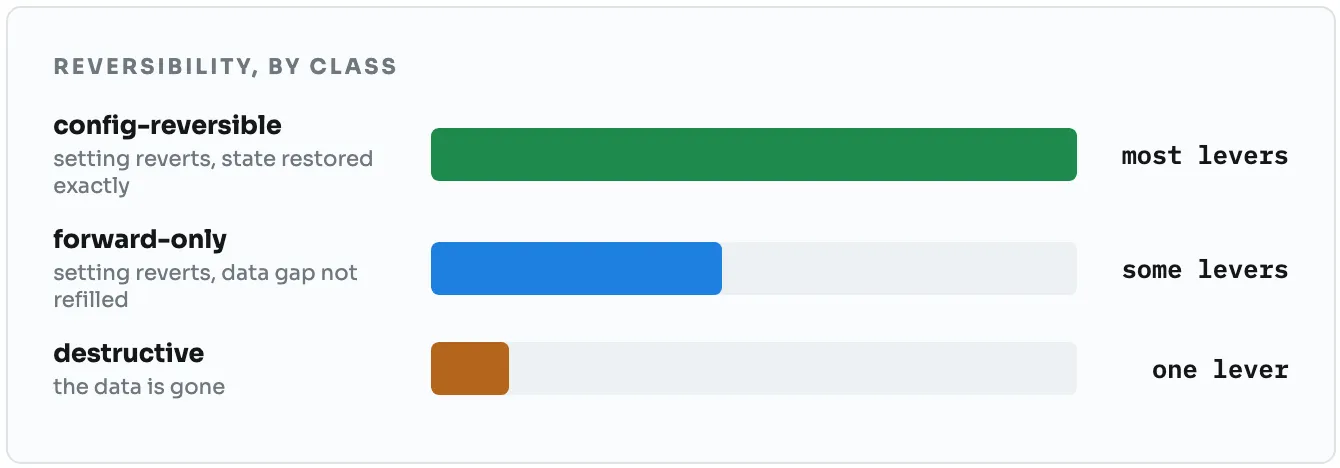
- config-reversible. The setting reverts and the state comes back exactly.
- forward-only. The setting reverts, but the gap in data is not refilled.
- destructive. The data is gone. One lever, off by default, needs a second confirmation.
What a bill cannot see
A bill shows one number per service. The agent sees inside it: the namespace, the workload, the one label inflating cardinality.
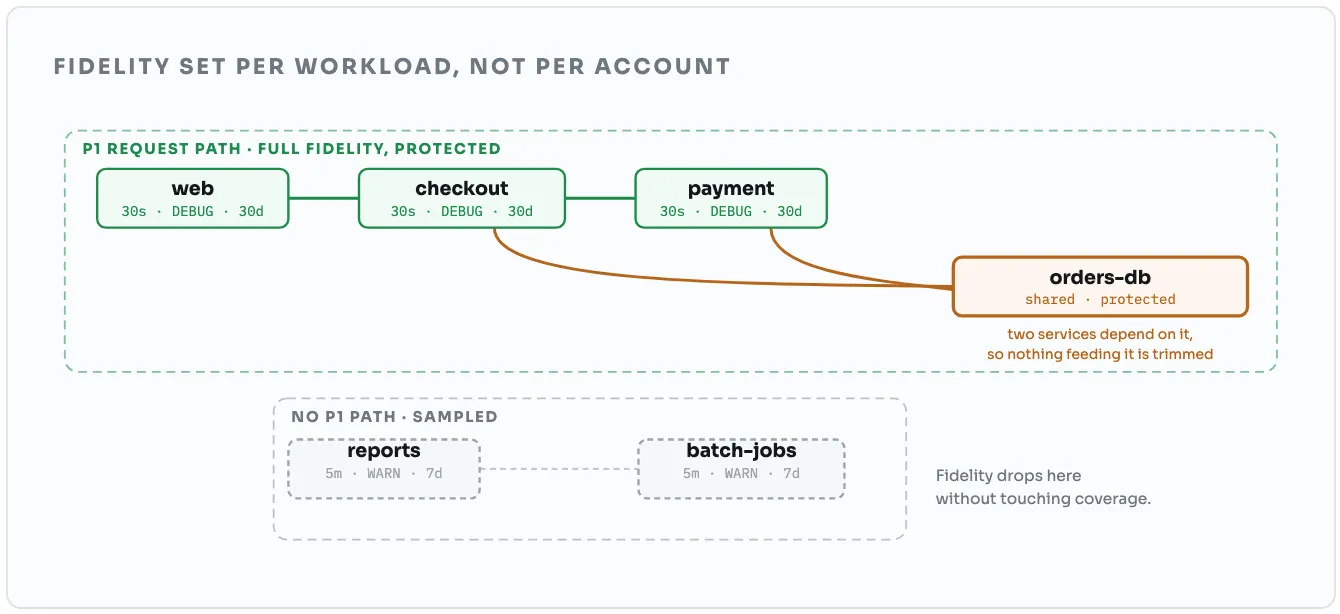
That precision comes from living in the cluster. An external tool reading an invoice cannot see a namespace, so it can only ever propose a percentage.
The plan cuts deeper and protects the investigation, because it comes from the same model the agent diagnoses with.↑ Back to top
One dial, three notches
You choose the posture. No notch deletes your data. It is tiered, not deleted.
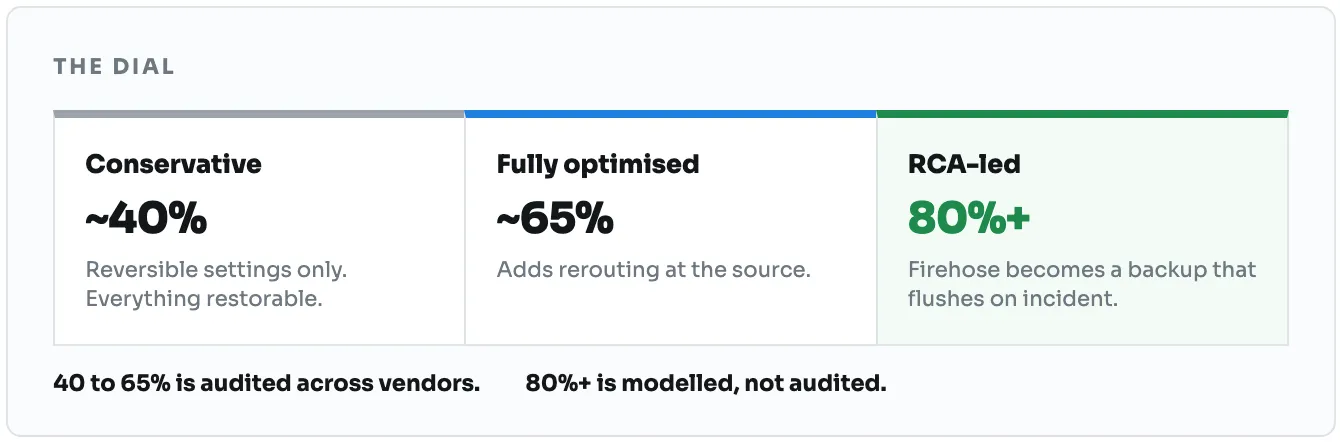
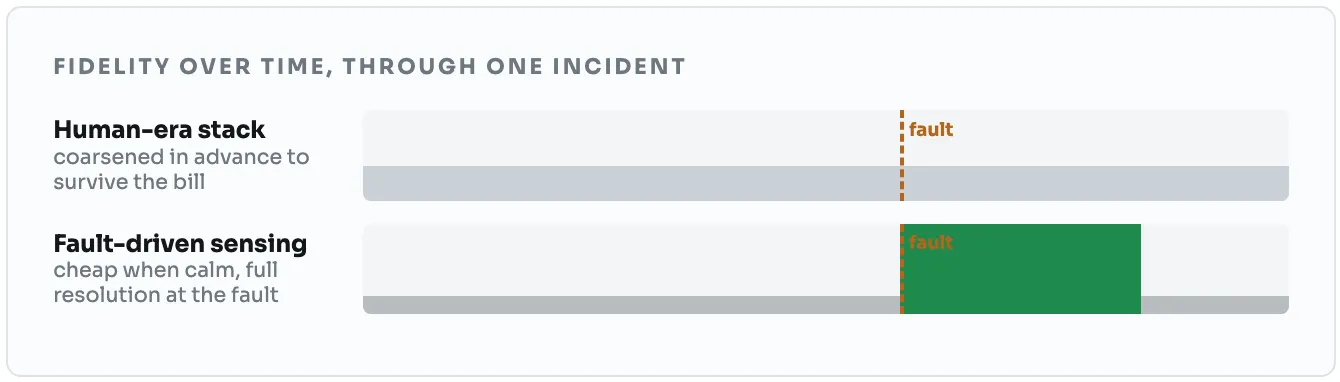
At the deepest notch the backend changes job. Because the agent investigates on the live stream, the paid firehose no longer has to be the real-time source. It becomes a backup, flushed back to hot the moment an incident opens.
↑ Back to topThe same estate, three ways
Modelled on a mid-size estate: roughly 200 to 240 nodes, 4,000 to 5,000 pods, about 1.4 million active series.
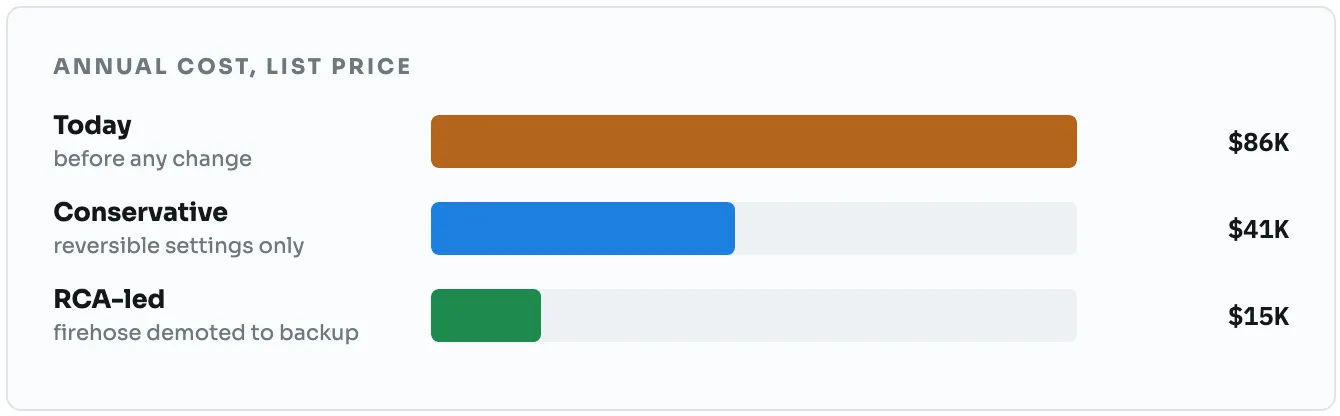
| Posture | After | Saved | Cut |
|---|---|---|---|
| Conservative | $41K | $45K | 52% |
| RCA-led | $15K | $72K | 83% |
Data is tiered, not deleted, in both. The paid ingestion and the hot tier shrink. The data survives in cold storage.
↑ Back to topPlan, apply, verify, rollback
A plan that saves money by turning telemetry off is easy to write and impossible to trust. This is what makes it checkable.
- Stage 01
Plan
The exact call, the state before, the state after, the revert call, the dollar basis, the canary scope. Dry-run by default.
- Stage 02
Apply
The plan opens as a pull request in your repository. The merge is the approval. Your own CI runner applies the smallest slice first, under your credentials, and journals each step.
- Stage 03
Verify
Measured drop in ingestion within hours, not a day-late bill. Coverage guards run alongside.
- Stage 04
Rollback
Revert the pull request. Your runner replays the journal backwards and restores the configuration exactly.
The same loop on every vendor
Each platform is read through its own API, read-only, normalised onto one rate card, and changed only through its own native controls, from your own pipeline.
| Platform | Levers used |
|---|---|
| Datadog | Metrics without Limits, log exclusion filters, rehydration |
| Grafana Cloud | Adaptive Metrics and log tiers |
| New Relic | Drop rules and per-type retention |
| Elastic | Lifecycle tiers, searchable snapshots, rollups |
| Splunk | Index retention and tiering |
Every vendor's own cost tooling is real and worth running. All of it shares the two limits from section 9.
↑ Back to topWhy no FinOps tool can do this
A cost tool knows what every stream costs, and nothing at all about what any stream answers.
Invoice layer
Commitments, rates, waste reports, chargeback. Sees what each stream costs. Cannot change what is collected, or where it lives.
Architecture layer
Collection, routing, tiering, cardinality, at the source. Sees what each stream answers. Because the model weighing the evidence also closes the incidents.
An assistant weighs what you already ship, so it can only ask you to ship more. Autonomy weighs everything, and the scale tips to the free side.
No tool that only reads bills can produce that column. No tool that only reads telemetry can either. It takes the thing doing the fixing to also do the accounting.
↑ Back to topWhat this is not
Every claim here has a limit, and the limits matter more than the headline.
Not deletion
Data is tiered, not deleted. What you read stays hot. The rest moves to cheap storage and stays queryable.
Not replacement
We right-size what you send. We do not replace the platform you send it to.
Not a one-time cleanup
Estates drift. New clusters log by default and cardinality creeps. Each cut is re-derived continuously, so the saving is re-earned rather than decaying.
↑ Back to topThe bill becomes a lever
The saving is the consequence, not the goal.
Start where we started. Three quarters of the evidence an investigation needs is free and already in your cluster. The quarter you pay for costs more than it is worth.
That imbalance made sense once. Observability was built for a person who might look later, so everything was kept hot just in case. The only way to answer a question was to move the data to the person.
An agent changes the direction of travel. The data stays where it is made. The question goes to the data. And the agent becomes the one interface over all of it, hot or cold, in plain language.
Spotting a fault and doing nothing about it is not health. It only makes the outage well documented.
Observability was only ever the sensor. The bill stops being a fixed cost and becomes a lever you keep pulling.
And you can judge each rung before taking the next. The bill proves the agent reads your estate correctly. Time to recover proves it can reason about it. Only then does a fault class earn the right to act without waiting for a person.
You should not take this on trust. The next page is how to get your own number, read-only, in about half an hour.
↑ Back to topGet your own number
A 30-minute, read-only scan of your estate. We run it with you and hand you the report.
The terms
- Read-only. No write access at all.
- Runs in your environment. Your data does not move.
- Only a summary report leaves. Findings, never raw telemetry.
- Nothing to install to see the number.
- The report is yours to keep, whatever you decide.
- If the plan recommends nothing, it says so. That is a useful answer too, and it is still free.
Key terms, in plain English
Plain-English definitions of the terms used in this guide, from active series to blast radius.
| Term | What it means |
|---|---|
| Active series | One metric plus one set of labels. The unit metrics are billed on. |
| Ingestion | Paying for data as it arrives. On most platforms this is most of the bill. |
| Retention | How long data is kept. Drives storage, not the ingestion charge. |
| Cardinality | How many distinct series a workload produces. Extra labels inflate it fast. |
| Tiering | Moving cold data to cheap storage and keeping it. Still queryable. |
| Coverage-gated | A cut is only proposed while the agent can still find that fault without it. |
| List price | The rate before credits. Credits are reported separately. |
| Topology model | A live map of what runs where, what depends on what, and which resources are shared. Derived read-only from the cluster. |
| Blast radius | Everything downstream of a failing component. Knowing it turns a storm of alerts into one incident. |
| Data Tax | The cost of keeping everything hot for a person who might look later. |
| Central data cloud | Ship all data to one place, then query it there. |
| Distributed data cloud | Data stays where it is produced. The agent reads it in place and is the one interface. |