In short
- Six tools describe an agent that detects, diagnoses and moves toward fixing production incidents, so the descriptions are nearly identical. What separates them is what each does at the end of an investigation, and whether there is any way to measure it.
- The guide scores every tool, DataAgent included, on the same six axes: remediation, verification, proof environment, Kubernetes and cloud depth, effect on your bill, and deployment and data.
- Every claim about another vendor comes from that vendor's own public documentation, linked and dated. Where nothing is published, the guide says so.
- Buy breadth if you cannot see the fault. Buy depth if you can see it and still cannot fix it.
- The test that settles it is to inject a failure that matters to you in a non-production cluster and watch what each tool does.
In this guide
One product, compared across the whole of it
DataAgent is a loop, not a feature. It detects, models what is running and what changed, correlates, reasons to a root cause, decides whether a person must approve the fix, hands the fix to your own pipeline, verifies and learns. Every tool in this guide implements some part of that loop, and almost all of them stop in the same place.
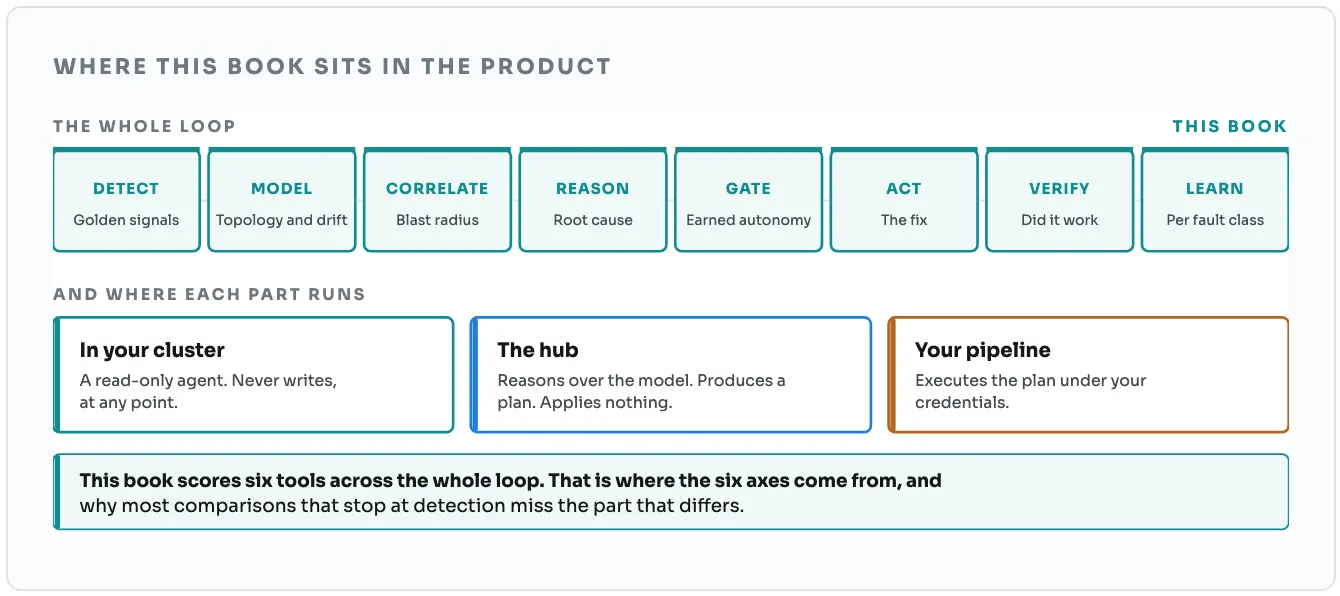
The axes in the next section map onto this drawing. Remediation is Act, verification is Verify, the proof environment is what Learn needs to be worth anything, and depth is how much of the left-hand side a tool can actually see.
↑ Back to topEveryone in this category says autonomous
Six tools describe an agent that detects, diagnoses and moves toward fixing production incidents. The descriptions are nearly identical, so comparing them is useless. What separates them is what each one does at the end of an investigation, and whether there is any way to measure it.
Tools that describe an agent that acts
6 in this guide alone, including every major incumbent. Each one can point at a product page describing an agent that detects, diagnoses and acts. On the marketing, the category looks solved.
Tools that publish a way to measure it
1 a fault catalogue with a known answer for every fault. A sandbox where the fault is injected on purpose and the right answer is known in advance. Without one, nobody, including the vendor, can tell you how often the agent is right.
That gap is the reason this guide scores six axes rather than listing features. Three of the six are about what happens after the diagnosis, which is where the category actually differs and where almost no marketing page goes.
The six axes, and why each one is here
Scored the same way for every tool, including ours. A roundup that scores a vendor one way and a comparison page that scores it another is how a set of pages like this loses a reader, so all of it comes from one source.
Remediation
At the end of an investigation, what actually happens? Every tool says autonomous. The useful distinction is between suggesting a fix, drafting one for a human to merge, running with approval, and running without waiting for a person for a fault class that has earned it.
Verification
Does it prove the fix worked, or only report that it ran? An action that is applied and not checked is an action you still have to check. Verification is also what makes autonomy revocable: a fault class whose fixes stop working should go back to waiting for a person, automatically.
Proof environment
Is there a way to measure the claim? A reproducible sandbox where faults are injected on purpose and the right answer is known in advance. Without one, coverage is a list somebody wrote.
Kubernetes and cloud depth
Deep on two planes, or wide across everything? Breadth wins when the problem is that you cannot see something. Depth wins when a NetworkPolicy, a PodDisruptionBudget or an IAM deny changed and nothing connected that change to the symptom.
Effect on your bill
Does the architecture inflate it, cut it in one product, or cut it everywhere? A vendor priced on ingestion cannot cut your ingestion without cutting its own revenue. That is a structural fact about the pricing model, not a criticism of the engineering.
Deployment and data
Read what you already run, or centralise first? Centralising is the expensive step and the one that takes a quarter. Reading in place is what makes an assessment possible in an afternoon.
The matrix
Six axes, six tools. The detail behind every cell is in that tool's chapter. Not published means we looked and found nothing either way.
| Axis | DataAgent | Resolve AI | Datadog | Dynatrace | Splunk and Cisco | Grafana Cloud |
|---|---|---|---|---|---|---|
| Remediation | Yes | Partly | Partly | Partly | Partly | Partly |
| Verification | Yes | Not published | Partly | Partly | No | No |
| Proof environment | Yes | No | No | No | No | No |
| Kubernetes and cloud depth | Yes | Partly | Partly | Partly | Partly | Partly |
| Effect on your bill | Yes | No | Partly | No | No | Partly |
| Deployment and data | Yes | Partly | No | No | No | Partly |
And ours, on the same six axes
Every other tool here gets a chapter stating its claims and where it beats us. It would be a poor comparison if the one making it were the only column not written out.
- Remediation
- Yes: Your pipeline executes; autonomy earned per fault class. The hub produces a plan and never applies it. The plan becomes a pull request in your repository, the merge is the approval, and your own CI runner executes it with the DataAgent CLI, under your credentials. Write access never goes to DataAgent. What a fault class earns is whether its plan waits for a person, never who holds the key. Every fault class is separately gated, auditable and revocable.
- Verification
- Yes: Verifies the fix, then learns from the outcome. The loop does not end when an action is applied. It ends when the signal that opened the incident returns to normal. The incident is then updated with what ran and what the verify step found, and stays the system of record for every fault the estate has handled.
- Proof environment
- Yes: 35 catalogued faults, 32 injectable with an answer key. A resettable sandbox where a fault is injected on purpose and the expected root cause and remediation are known in advance. That is what turns a claim about coverage into a measurement.
- Kubernetes and cloud depth
- Yes: Deep on two planes: Kubernetes and the cloud control plane. Both planes down to the control-plane objects that actually change: NetworkPolicies, PodDisruptionBudgets, StorageClasses, IAM policies, security groups, node pools. Deliberately not wide.
- Effect on your bill
- Yes: Cuts ingestion across the estate, at the source. Acts before the charge rather than after it, across every backend rather than one vendor's, and every cut is checked against keeping fault detection intact.
- Deployment and data
- Yes: Reads in place, read-only, and never takes the write. Queries the backends you already run with their own APIs. Raw telemetry stays where it was born; only findings leave. Nothing is opened inward, and write access never goes to DataAgent at any point in the life of the install.
What AI SRE for Kubernetes actually means
The phrase covers two different products. One watches everything and tells you what it sees. The other goes deep on a small number of planes and changes them. Which you want depends on whether your problem is seeing the fault or fixing it.
Wide and shallow, or narrow and deep
Every observability incumbent in this guide is wide. Datadog, Dynatrace and Splunk cover hundreds of technologies across every signal type, and on that axis none of the AI-native tools come close. If your problem is that something in your estate is invisible, buy breadth. That is a real answer and this guide will not pretend otherwise.
Depth is a different product. A Kubernetes and cloud estate fails in a narrow, knowable set of ways, and most of them start with a change to a control-plane object rather than a spike on a graph. A NetworkPolicy loses a port. A PodDisruptionBudget leaves no room to evict. A StorageClass is renamed between clusters. An IAM policy gains an explicit deny. None of those produce an interesting metric. They produce a symptom somewhere else, minutes later, and the connection between the two is the whole job.
Breadth tells you what is going on. Depth tells you what changed, and a fix starts from that.
That is why this guide scores depth on two planes rather than counting integrations. It is also why the honest reading of the matrix is not that one tool wins. It is that the two kinds of product solve different problems, and the mistake is buying one expecting the other.
Four things worth asking any vendor in this category
These are the questions that separate the products, and all four are answerable from public documentation. If a vendor cannot answer one of them, that is the answer.
One: Who holds the credential that performs the fix?
The question most vendors answer vaguely, and the one with the largest consequence. Ask whether the agent itself is granted write access to your estate, or whether it produces a plan that something of yours executes. Our answer, so you can hold us to it: Otto, our agent, is read-only for its whole life. The hub produces a plan and never applies it. The plan becomes a pull request in your repository, the merge is the approval, and your own CI runner executes it with the DataAgent CLI, under your credentials. Write access never goes to DataAgent.
Two: How is autonomy granted, and how is it taken away?
A single switch that lets the whole agent act on everything is not a safety model, it is a toggle. Ask whether trust is granted per fault class, what evidence earns it, and what happens to a fault class whose fix stops working. Ask us the same thing.
Three: What is the agent measured against?
Not a demo, and not a customer quote. A list of failures, a way to inject them, and a known right answer for each. This is the row in the matrix where every competitor in this guide reads the same.
Four: What does the pricing model let them do?
A vendor billed on the volume you send it has no structural route to cutting that volume. This is not an accusation of bad faith; it is arithmetic. Ask what the product does to your observability bill and whether the answer is compatible with how the vendor is paid.
Where right-sizing comes into it
The fourth question is the one most comparisons skip, and in a Kubernetes estate it is often the largest number on the table. An agent that pulls only the evidence a fault actually needs does not need everything collected continuously, which is the same observation from the other end: the cost of the stack and the design of the agent are the same decision. A tool that charges by ingestion and a tool that reduces ingestion are not two products in one category. They are opposite bets.
↑ Back to topResolve AI and DataAgent, compared
Resolve AI is the closest thing to a direct competitor: same category, same pitch, no conflict of interest about selling you more telemetry. It raised a $125M Series A in February 2026, and its topology discovery is the best we have seen. The difference is not the pitch. It is what either of us can prove.
What Resolve AI is
An AI production engineer delivered as SaaS with an in-cluster Satellite agent. Strong topology discovery, parallel-agent investigation, and a positioning that includes running commands and opening pull requests.
What it is genuinely good at
- Topology discovery is genuinely excellent once the Satellite agent is installed. Mapping what depends on what is the hardest part of this problem and they do it well.
- Parallel-agent investigation, which gets to a hypothesis faster than a single-threaded loop.
- Founders from Splunk and OpenTelemetry.
- Among the AI-native tools, the best funded by a wide margin, which buys iteration speed.
Resolve AI on the six axes
- Remediation
- Partly: Positions as executing; autonomy model not published per class. Resolve AI positions as an AI production engineer that can run commands and open pull requests. What is not published is how autonomy is granted and withdrawn: whether it is one switch for the agent or a separate decision per fault class. Ask for that model, and ask it of us too.
- Verification
- Not published: Not publicly documented. No public documentation of a step that confirms the fix returned the signal to normal, nor of what happens to the agent's permissions when a fix fails.
- Proof environment
- No: No published fault environment. No published injectable, resettable fault substrate with an answer key. Without one there is no way for a buyer, or the vendor, to measure which failures are actually handled.
- Kubernetes and cloud depth
- Partly: Strong on Kubernetes topology, breadth over control-plane depth. Topology discovery is the strength. Cloud control-plane change attribution, the IAM and security-group layer, is less evident in what is published.
- Effect on your bill
- No: Does not address observability spend. A SaaS subscription on top of the observability stack you already pay for. Nothing in the product reduces that bill.
- Deployment and data
- Partly: SaaS with an in-cluster agent. The Satellite agent runs in your cluster and the reasoning happens in their cloud.
Both of us say autonomous. Only one of us publishes a fault catalogue with a known answer for each fault, so you can check.
Choose Resolve AI when
You want the strongest topology map in the category and you are buying investigation speed, with a human applying the fix.
Choose DataAgent when
You want the fix applied and verified, you want autonomy granted per fault class rather than per agent, and you want to measure the claim before you trust it.
Every claim in this section comes from Resolve AI's own documentation. The links, with the date each was checked, are listed at the back of this guide.
Sources checked 1 September 2026.
↑ Back to topDatadog and DataAgent, compared
Datadog is the most serious incumbent on this list. Bits AI SRE is generally available for investigation and triage, Bits Remediation can be configured to execute automatically in one environment while requiring approval in another, and in June 2026 Datadog bought Adaptive ML to train its agents from production signals. Nobody should dismiss that. The question is what the agent learns against, and what its architecture does to your bill.
What Datadog is
A centralised observability platform. Telemetry is ingested into Datadog's own lake and Bits AI agents correlate and act on it.
What it is genuinely good at
- Distribution and breadth that nobody in this category can match. If a technology exists, Datadog has an integration for it.
- Bits Remediation and Bits Infrastructure Operations are the most mature act step among the incumbents: per-environment configurable auto-execute, for example automatic in staging and approval-required in production.
- The Adaptive ML acquisition in June 2026, and the Datadog AI Research lab it anchors, are a serious investment in the improvement loop rather than a feature release.
- A single vendor relationship, which for many organisations is worth more than any individual capability.
Datadog on the six axes
- Remediation
- Partly: Executes, gated per environment, in Preview. Bits AI SRE is generally available for investigation and triage. Bits Remediation and Bits Infrastructure Operations, which carry the execution, are in Preview rather than general availability. The gating is per environment, so the unit of trust is staging against production rather than the fault class.
- Verification
- Partly: Learns from production signals and an AI judge. The Adaptive ML approach re-trains from production signals, synthetic data and rewards scored by an AI judge. That is a real learning loop. What is not published is a step that confirms a specific fix returned the signal to normal.
- Proof environment
- No: No fault environment. No published injectable, resettable fault substrate with a verifiable answer key for the agent to learn against or be scored on.
- Kubernetes and cloud depth
- Partly: The widest coverage in the category. Breadth is the strength. Depth on the Kubernetes and cloud control plane is one area among hundreds rather than the whole product.
- Effect on your bill
- Partly: Cost controls inside Datadog, on an ingest-priced model. Datadog sells tools that trim its own bill, such as Metrics without Limits, Flex Logs and Observability Pipelines. The pricing model still means more coverage costs more, and the controls are built around Datadog's own bill.
- Deployment and data
- No: Centralise first. The model is to ship telemetry into Datadog and reason over it there.
Their learning loop is scored by production signals and an AI judge. Ours is scored against injected faults with a known answer key.
Choose Datadog when
You want one vendor across every signal type and every technology, and visibility breadth matters more to you than the depth of the loop.
Choose DataAgent when
Your ingestion bill is the problem rather than your visibility, or you want autonomy you can grant one fault class at a time and measure.
Every claim in this section comes from Datadog's own documentation. The links, with the date each was checked, are listed at the back of this guide.
Sources checked between 2 September and 16 October 2026.
↑ Back to topDynatrace and DataAgent, compared
Dynatrace has the strongest causal story of any incumbent. Davis AI is genuinely causal rather than correlational, Smartscape topology is excellent, and since July 2026 an Autonomous SRE Agent self-triggers on new problems rather than waiting for a hand-authored workflow. Two claims you may have read about Dynatrace are now out of date, and we will not repeat them.
What Dynatrace is
A centralised observability platform built on full-detail data capture, with Davis AI for causal root cause, Smartscape for topology, and AutomationEngine and Workflows for action.
What it is genuinely good at
- Davis AI is causal rather than correlational, which is a real architectural difference and not marketing.
- Smartscape topology is one of the two best dependency maps in the market.
- Since July 2026 the Autonomous SRE Agent self-triggers on new problems, and Davis CoPilot can autonomously edit manifests to autoscale infrastructure. This is no longer hand-authored workflows only.
- The staged autonomy journey, from insights to supervised to guardrailed autonomous, is an honest framing of a hard problem.
Dynatrace on the six axes
- Remediation
- Partly: Executes within a staged autonomy journey, inside its own stack. The Autonomous SRE Agent self-triggers and Davis CoPilot can autonomously edit manifests to autoscale. Dynatrace frames this as a journey from insights to supervised to guardrailed autonomous rather than a single general availability, and it runs inside Dynatrace's own data.
- Verification
- Partly: Strong causal engine; no published step that ties a remediation to recovery. Davis is causal, which is a better basis for confidence than correlation. What is not published is a step that confirms a specific remediation brought the signal back to normal.
- Proof environment
- No: No fault environment. No published injectable, resettable fault substrate with an answer key.
- Kubernetes and cloud depth
- Partly: Wide, and deepest inside its own data. Very strong on everything the OneAgent captures, weaker on data that lives in another vendor's backend. Full-detail capture is the source of both the depth and the cost.
- Effect on your bill
- No: Full-detail capture, consumption-priced. The quality of the causal analysis comes from capturing everything in full detail, which is also what makes it expensive. The pricing model has the same structural conflict as the rest of the incumbents.
- Deployment and data
- No: OneAgent, centralise first. The model is full-detail capture through OneAgent into Dynatrace.
Theirs is a staged autonomy journey, locked to their stack. Ours is earned per fault class and reads the backends you already run.
Choose Dynatrace when
You want the strongest causal root cause available, you are willing to run their agent everywhere, and you are prepared to pay for full-detail capture.
Choose DataAgent when
You want to keep the backends you have, you want autonomy granted per fault class with a published way to measure it, or full-detail capture is not something your budget supports.
Every claim in this section comes from Dynatrace's own documentation. The links, with the date each was checked, are listed at the back of this guide.
Sources checked 2 September 2026.
↑ Back to topSplunk, Cisco and DataAgent, compared
Cisco and Splunk is the broadest incumbent on this list, and the one where we are clearest about not competing. They have a network plane and a security operations centre that DataAgent does not touch and will not claim to. Where we do overlap, on Kubernetes and cloud SRE, their own documentation is unusually clear about what their SRE product does and does not do.
What Splunk and Cisco is
A cross-domain platform: Splunk for observability and security, ThousandEyes for the network plane, SOAR for automated security response, and since February 2026 a dedicated AI SRE product inside Splunk Observability Cloud.
What it is genuinely good at
- Cross-domain correlation across observability, security and the network, which nobody else on this list can do.
- Splunk SOAR is genuinely autonomous automation, in production, at scale. It is scoped to security operations, and within that scope it is the real thing.
- AgenticOps and Cisco AI Canvas, announced in June 2025, bring a shared AI workspace to network, security and IT teams.
- An enterprise install base and bundling power that makes it the default in a great many organisations.
Splunk and Cisco on the six axes
- Remediation
- Partly: Autonomous in the SOC, approval-required for SRE. Splunk SOAR runs genuinely autonomous playbooks, and it is scoped to security operations. The dedicated AI SRE product, generally available since February 2026, builds a remediation plan and in Splunk's own words relies on your engineering team to review, approve and execute it. On the SRE plane specifically, it is advisory.
- Verification
- No: No published verify step on the SRE plane. The plan is handed to a person, so confirming the fix worked is the person's job.
- Proof environment
- No: No fault environment. No published injectable, resettable fault substrate with an answer key.
- Kubernetes and cloud depth
- Partly: The widest of all, across three domains. Observability, security and the network. Depth on the Kubernetes and cloud control plane is one part of a very large surface.
- Effect on your bill
- No: Ingest-priced at its core. Splunk's revenue grows with the volume you send it, which is the structural conflict this axis is about.
- Deployment and data
- No: Universal ingestion. The model is to centralise everything into Splunk and correlate it there.
They correlate everything, after you pay to centralise it. We read it in place and close the Kubernetes and cloud loop.
Choose Splunk and Cisco when
Your incidents cross the network and security boundaries, you already run Splunk, or cross-domain correlation is the capability you are buying.
Choose DataAgent when
Your incidents are Kubernetes and cloud, the Splunk ingest bill is a problem you have been asked to solve, or you want the SRE loop closed rather than planned.
Every claim in this section comes from Splunk and Cisco's own documentation. The links, with the date each was checked, are listed at the back of this guide.
Sources checked between 1 September and 16 October 2026.
↑ Back to topGrafana Cloud and DataAgent, compared
Grafana is the best open, multi-source observability platform there is, and if you have Adaptive Metrics switched on you have already taken real cost out. The difference is where each tool acts: Adaptive works inside Grafana, after ingestion. DataAgent acts on ingestion across the whole estate, and closes the loop on the fault.
What Grafana Cloud is
An open observability platform that reads from more than 100 data sources, with Sift and Asserts for investigation, Adaptive Metrics and Adaptive Logs for cost, and Grafana Assistant for investigation and automation.
What it is genuinely good at
- Breadth of data sources. Very little in an estate cannot be put on a Grafana dashboard.
- Open source at the core, which means no lock-in on the query layer and a large community.
- Adaptive Metrics and Adaptive Logs are a genuine cost tool. Grafana reports a 20 to 50% reduction, and they respect existing usage so dashboards and alerts do not break.
- Cost attribution inside Grafana Cloud is clear: cardinality and usage views show where the money goes.
Grafana Cloud on the six axes
- Remediation
- Partly: Drafts a fix for a human to merge. Grafana Assistant Automations, generally available since July 2026, can diagnose and auto-generate GitHub issues, pull requests and draft branches, with a Slack nudge for a human to merge. Grafana calls this human on the loop. It is a real act step that stops short of changing live infrastructure.
- Verification
- No: No published verify step. Nothing in the public documentation describes confirming that a merged fix returned the signal to normal. The loop ends at the pull request.
- Proof environment
- No: No fault environment. No published injectable, resettable fault substrate with an answer key to score an agent against.
- Kubernetes and cloud depth
- Partly: Very wide, moderately deep on Kubernetes. Kubernetes monitoring is well covered. Cloud control-plane change attribution, the IAM and security-group layer where a large share of production faults originate, is not the platform's centre of gravity.
- Effect on your bill
- Partly: Cuts its own bill, after ingestion. Adaptive lowers what Grafana bills for, but only after the data is collected and shipped. The collection and shipping still happen, and other backends are outside its view entirely.
- Deployment and data
- Partly: Agent-based collection into Grafana Cloud. Grafana Alloy ships telemetry into Grafana Cloud. Some sources can be queried where they are, but the product's centre of gravity is collection.
Grafana optimises what you query, inside Grafana. DataAgent right-sizes the whole estate at the source, and fixes the fault rather than drawing it.
Choose Grafana Cloud when
You want one place to see everything, you value open source at the query layer, and your estate is mostly inside Grafana Cloud already.
Choose DataAgent when
You run more than one backend, your bill is ingestion rather than storage, or you want the fault fixed and verified rather than charted.
Where Grafana Cloud and DataAgent work together
Keep Grafana Cloud and keep Adaptive doing its job inside it. After Adaptive has run, roughly 25 to 40% (our modelled figure, from DataAgent assessments) is usually still on the table across the rest of the estate: cross-vendor duplication, and ingestion into backends Adaptive cannot see.
What Adaptive already reaches
Telemetry that has already arrived in Grafana Cloud. It looks at how series and log patterns are used across dashboards, alerts and queries, then aggregates away what nobody reads, without breaking what does get read. Grafana reports a 20 to 50% reduction, and if you have run it you have taken the savings that live inside Grafana.
What it structurally cannot reach
The ingestion itself, because it prunes after the data has arrived and the charge has been incurred. Your other backends, because it only sees Grafana Cloud. And cross-vendor duplication, where the same telemetry is shipped to more than one place and paid for more than once, which a single-vendor tool cannot see at all.
Every claim in this section comes from Grafana's own documentation and pricing pages. The links, with the date each was checked, are listed at the back of this guide.
Sources checked 2 September 2026.
↑ Back to topWhich AI SRE tool should you actually buy?
The honest answer is that it depends on which of two problems you have, and the two are easy to confuse. Here is the call, said plainly, including the cases where the answer is not us.
Buy breadth if you cannot see the fault
If incidents are hard because something in the estate is dark, the answer is an observability incumbent and probably Datadog. Nothing in this category matches its coverage, its agent is generally available for investigation, and its remediation preview is the most mature act step any incumbent ships. Dynatrace is the better buy if causal root cause matters more to you than integration count, and it is closing the autonomy gap faster than anyone else on this list. Splunk and Cisco is the answer when your incidents cross into the network or the security operations centre, which is a plane we do not cover at all.
Buy depth if you can see it and still cannot fix it
If your dashboards are fine and the time goes on working out what changed and then applying the fix by hand, breadth does not help. That is the problem DataAgent is built for, and the one Resolve AI is competing for too. Resolve AI has the better topology map. We publish the fault catalogue, so you can test the claim rather than take it.
Grafana Cloud is not really on this axis
It belongs on the list because people compare it, and on the fix itself it is not really competing. Keep it, keep Adaptive running inside it, and the question about the rest of the estate is still open.
↑ Back to topThe verdict
Worth switching only if your problem is the fix, not the view. If you cannot see the fault, buy breadth first and come back to this guide afterwards.
Two conditions on that, and both are things you can establish before talking to anyone.
First, check that the fix is really where the time goes. Take the last ten incidents and split each one into time spent finding out what was wrong and time spent putting it right. If the first number dominates, a better view is the right purchase and this guide is pointing you at the wrong half of the market.
Second, make the vendor prove it before you trust it. Whichever way you go, ask for the fault list, the way to inject one, and the known right answer. If the vendor has none of those, what you are buying is a claim. That applies to this guide too, which is why the next page is how to check ours.
↑ Back to topHow to check any of this yourself
A comparison written by one of the vendors is worth exactly as much as its sources. Here is where every claim in this guide came from, and how to test the part that matters most without taking anyone's word for it.
What is in here, and what is deliberately not
- Every competitor claim comes from that vendor's own public documentation or announcements, linked on the next page with the date it was checked. Nothing is inferred from a demo or a conversation.
- Where nothing is published, the guide says so. One cell in the matrix reads not published. That is not a score of zero, it is an absence in the public record, and it is reported as one.
- We ran some of these tools against injected faults ourselves. Those results are not in this guide. They are a point-in-time snapshot of fast-moving products, and publishing a stale measurement against a named competitor would be the same unverifiable claim this guide is arguing against.
- Our own numbers are labelled as ours. Thirty-five catalogued faults and thirty-two injectable ones are counts from our published catalogue, and the 25 to 40% on the Grafana pages is our modelled figure. Neither is third-party research.
The test that settles it
Pick a failure that matters to you. A NetworkPolicy that drops the database port, an IAM deny on a secret, a CPU limit cut until the service browns out. Inject it in a non-production cluster, on purpose, and watch what each tool does. Not whether it draws a graph: whether it names what changed, whether it fixes it, and whether it tells you afterwards that the fix held.
That takes an afternoon and it answers more than any comparison table, including this one. The fault catalogue we use is published, so you can reproduce the same faults and run them against every tool on this list, and get a result that belongs to you.
↑ Back to topEvery claim, and where it came from
All vendor links are to that vendor's own site. Dates are when the page was last checked for this guide. The market figures used elsewhere in the DataAgent guide series come from the published surveys cited there, and none of them are used in this one. The one figure of our own beyond the fault counts, the 25 to 40% left after Adaptive, is our modelled figure from DataAgent assessments.
Resolve AI
- Resolve AI product site. https://resolve.ai/ · checked 2026-09-01
- Series A, $125M at a $1B valuation (February 2026). https://resolve.ai/blog · checked 2026-09-01
Datadog
- Bits AI SRE and Bits AI agents. https://www.datadoghq.com/product/platform/bits-ai/ · checked 2026-09-02
- Datadog acquires Adaptive ML (June 30 2026). https://www.datadoghq.com/about/latest-news/press-releases/datadog-acquires-adaptive-ml-to-accelerate-its-investment-in-ai-research-and-development/ · checked 2026-10-16
- Datadog pricing. https://www.datadoghq.com/pricing/ · checked 2026-09-02
Dynatrace
- Dynatrace AI agents and the autonomy journey. https://www.dynatrace.com/platform/artificial-intelligence/ · checked 2026-09-02
- Davis CoPilot. https://www.dynatrace.com/news/blog/ · checked 2026-09-02
Splunk and Cisco
- Splunk AI SRE product page (generally available February 2026). https://www.splunk.com/en_us/products/observability.html · checked 2026-09-01
- Splunk SOAR. https://www.splunk.com/en_us/products/splunk-security-orchestration-and-automation.html · checked 2026-09-01
- Announcing Cisco AI Canvas, AgenticOps (June 2025). https://newsroom.cisco.com/c/r/newsroom/en/us/a/y2025/m06/announcing-cisco-ai-canvas-revolutionizing-it-with-agenticops.html · checked 2026-10-16
Grafana Cloud
- Grafana Assistant Investigations and Automations. https://grafana.com/docs/grafana-cloud/machine-learning/assistant/ · checked 2026-09-02
- Adaptive Metrics documentation. https://grafana.com/docs/grafana-cloud/adaptive-telemetry/adaptive-metrics/ · checked 2026-09-02
- Grafana Cloud pricing. https://grafana.com/pricing/ · checked 2026-09-02
- Understand metrics usage and cost. https://grafana.com/docs/grafana-cloud/cost-management-and-billing/understand-usage-cost/metrics/ · checked 2026-09-02
A note on fairness. Products in this category change every quarter. If something here is out of date or wrong, it is a mistake rather than a tactic, and we would rather fix it: tell us at data-agent.co and the guide gets corrected, with the date on it.
↑ Back to top