In short
- A Kubernetes estate fails in a narrow, knowable set of ways, and most of those start with a change to a control-plane object rather than a spike on a graph.
- DataAgent keeps a living model of what is running and what changed, and watches seven signal sources inside the cluster, all emitted on the K8sGPT Result CRD contract rather than a format of its own.
- The agent stays read-only for its whole life and connects outbound only. Every change runs in your own pipeline, under your credentials.
- Autonomy is earned per fault class, on a verified record, and lost again when the class stops working.
- The first step is a free, read-only assessment. The useful second step is breaking one fault on purpose in a cluster you control.
In this guide
One product, and the part of it this guide is about
DataAgent is a loop, not a feature. It detects, models what is running and what changed, correlates, reasons to a root cause, decides whether a person must approve the fix, hands the fix to your own pipeline, verifies and learns. This guide is mostly the sensing half, on the Kubernetes plane, with a short tour of the rest of the loop.
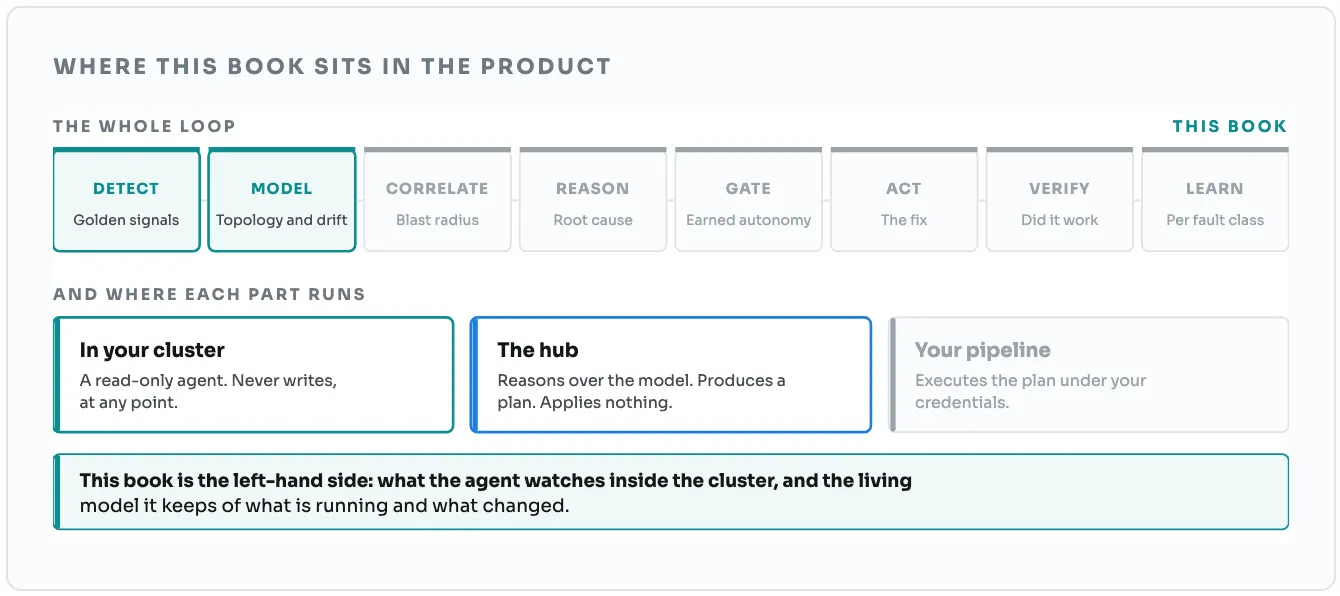
The stages to the right are the subject of the other guides. Remediation First in Action covers the approval, the fix and the verify. What Are You Actually Covered For? covers how to measure whether Detect would fire in the first place.
↑ Back to topA cluster does not fail the way a graph says it does
The symptom shows up in one place and the cause is almost always a change somewhere else, usually to an object nobody is graphing. That gap between the symptom and the change is where the time goes, and it is the whole problem a Kubernetes-native agent has to solve.
What the dashboard shows
Latency on checkout. Error rate up. A pod restarting. All true, all downstream, and none of it names a cause. Every tool in this category can draw this. It is the easy half.
What actually happened
A NetworkPolicy lost its egress rule for port 5432. A StorageClass was renamed between clusters. A ConfigMap value was flipped by hand at 09:14. None of those produce an interesting metric. They produce a symptom somewhere else, minutes later.
This is why breadth helps less than it looks. A platform that covers three hundred technologies still has to be told that a PodDisruptionBudget leaving no room to evict is why your node drain has been retrying for forty minutes. Depth on one plane, down to the objects that actually change, is a different product from width across many.
What that implies about where to start
If the cause is a change to a control-plane object, then three things follow, and they are the three decisions this guide is about.
One: Keep the model, do not rebuild it
An agent that discovers your topology when the incident starts is reading a system that is already broken. The map has to be maintained continuously and queried during the incident, not built during it.
Two: Watch the places changes actually appear
Events, the audit log, ConfigMap content, alert rules. Most of the places a change shows up are not metrics at all.
Three: Earn the autonomy, never the write
Nobody sensible gives a new agent cluster-admin, and this one never asks. What gets earned is smaller than the agent: whether one fault class can be fixed without waiting for a person. It is granted after evidence and revoked without ceremony.
Breadth answers what is happening. Depth answers what changed, which is the only question a fix follows from.
Questions this section answers
- Is this a replacement for my observability stack?
- No, and it is not trying to be. It reads the backends you already run. Section 10 is about right-sizing that stack, not replacing it.
- Does it need its own agent in the cluster?
- Yes, a read-only one, and it stays read-only. Section 6 is exactly what it runs, what it connects to, and which direction the connection goes.
The model comes before the telemetry
A persistent, living model of topology, drift and control-plane state, maintained continuously and queried during an incident rather than rebuilt from scratch when one starts. Everything else in the loop reads from it.
Why rebuilding it per incident does not work
The common pattern in this category is to discover the dependency graph reactively: an incident opens, the agent walks the cluster, and it works out what talks to what. That is elegant and it has one fatal property. The walk happens while the system is broken, so the map it produces is a map of the failure, not of the system. A Service with zero endpoints looks like a Service nothing depends on.
It also throws away the single most useful fact in a Kubernetes incident, which is not the current state but the difference between the current state and the state twenty minutes ago. You cannot diff against a map you just built.
What the model buys you, concretely
Rebuilt when the incident opens
Correlation. Three services degraded in the same five minutes and they are adjacent on the graph. That is a starting point for a human investigation, and it is the output most tools in this category stop at. It cannot tell you what changed, because it has nothing to compare against.
Kept continuously, queried on demand
Causation. The checkout NetworkPolicy lost its 5432 egress rule at 14:02. Three services depend on that path. Here is the rule as it was and as it is now. That is an answer. It also happens to contain its own fix, which is the reason the next three sections are possible at all.
Questions this section answers
- How is the model kept current without constant polling?
- Watches rather than polls, on the sources in the next section. That is what keeps the model current enough to diff against.
- What happens on a cluster it has never seen?
- It builds the model read-only, before any incident and without any write permission. The free coverage assessment is separate and needs no agent at all. What Are You Actually Covered For? explains how it works.
What it actually watches, and why seven sources
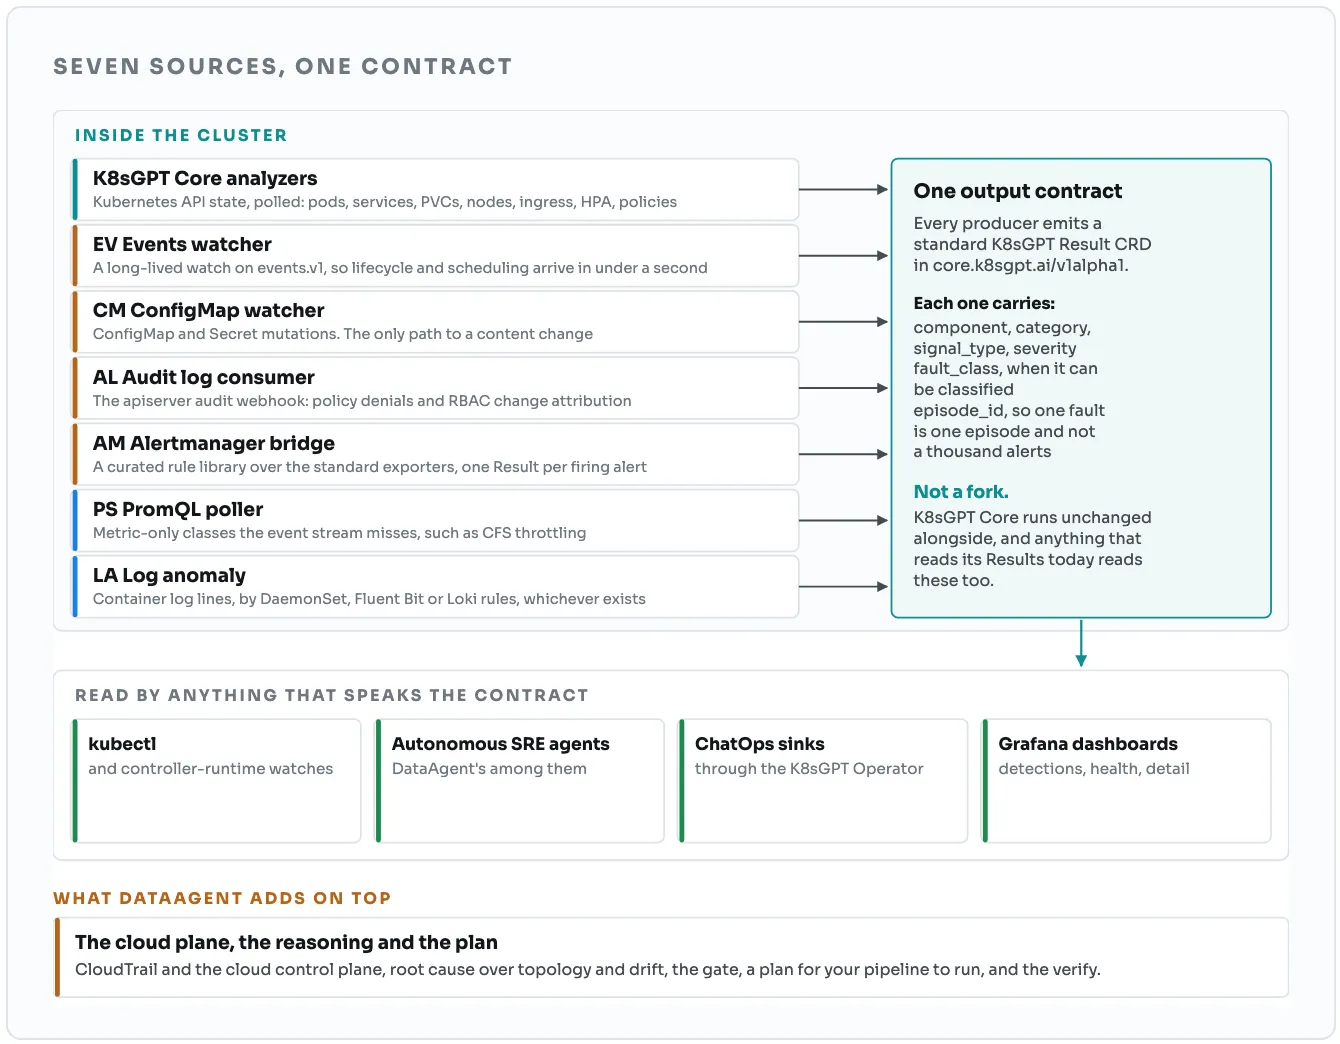
Kubernetes publishes the truth about itself in several places, and no single one of them is enough. Four of the seven are not metrics at all, and two are invisible to anything that only polls the Kubernetes API.
Why each one is on the list
The analyzers that ship with K8sGPT cover Kubernetes API state well: pods, services, deployments, claims, nodes, ingress, autoscalers, policies, budgets. That is a real share of Kubernetes faults and it is the floor, not the ceiling. The other six exist because whole categories of real incidents are structurally outside an analyzer that polls API state.
Latency: the events watcher
A polling cycle is a floor on how late you can be. A long-lived watch on events.v1 puts pod lifecycle, scheduling and storage events in front of you in under a second, which matters because FailedScheduling and Liveness probe failed are written the instant they happen and expire an hour later.
Content: the ConfigMap watcher
The only source that sees what changed inside a ConfigMap, not just that it exists. Section 4 shows why that matters.
Attribution: the audit log consumer
The apiserver audit webhook carries policy denials and full RBAC change attribution. This is the source that answers who, which is the question that makes a root cause actionable rather than interesting.
Thresholds and text: alerts, PromQL and logs
Some classes only exist as a number crossing a line, such as CFS throttling, and some only exist as a line of text in a container log. The alert bridge, the PromQL poller and the log-anomaly source cover those, and the log source adapts to whatever log infrastructure the cluster already has rather than adding another.
Built on K8sGPT, not forked from it
Every signal source emits a standard K8sGPT Result CRD. That is a deliberate constraint rather than a convenience: it means nothing you already run has to change, and nothing you adopt here can only be read by us.
What that buys a cluster operator
- K8sGPT Core runs unchanged. No fork, no patched analyzer protocol, no second copy of a CNCF project to keep in step. The detection components are siblings of the analyzers, not replacements for them.
- Anything that reads Result CRDs today reads these. Your existing K8sGPT Operator, its sinks, your Slack routing, a controller you wrote yourself. If it watches core.k8sgpt.ai/v1alpha1, it keeps working.
- Each component installs on its own. Standard Helm charts, adopted one at a time. Run the events watcher without the ConfigMap watcher, run the alert rules without the audit consumer.
- You can leave. The detections are Kubernetes objects in your own cluster, in a published format. Nothing about the exit is harder than deleting a chart.
Where the line is drawn
There is a clear boundary between what runs in your cluster on an open contract and what DataAgent adds. It is worth stating plainly before you adopt either half.
In the cluster, on the contract
Kubernetes-only detection. The seven producers, the Result CRDs, the labels, the dashboards. All of it watches Kubernetes-resident sources and nothing else, by design.
What DataAgent adds
The cloud plane, the reasoning and the plan. CloudTrail and cloud control-plane changes, root cause over topology and drift, the gate, a remediation plan for your pipeline to run, and the verify step afterwards. The reason the cloud plane sits on the commercial side is not packaging. It is that a Kubernetes-scoped project should stay Kubernetes-scoped: the moment it starts reaching into CloudTrail and IAM it stops being something a cluster operator can reason about and starts being a platform. Section 9 is why you still need that second plane, and what it costs you to go without it.
Questions this section answers
- Do I have to run DataAgent to use this?
- No. The detection components are useful on their own, and the output is a published CRD format read by tools that have nothing to do with us. DataAgent is what turns a stream of detections into a diagnosis and a plan your pipeline runs.
- What if I already run K8sGPT?
- Then you already have the floor, and the components add the sources its analyzer model was not designed to reach: streaming events, content diffs, audit attribution, alerts and log patterns.
The faults nothing else in your cluster would catch
Three categories where the usual stack is structurally blind, not badly configured. Each one is a real incident shape, and each needs a source that most Kubernetes monitoring does not have.
Config drift, with no deploy anywhere near it
Someone edits a ConfigMap value in the cluster rather than through the pipeline. Nothing restarts, so nothing alerts. Pods that happen to restart later pick up the new value and behave differently from the ones that did not, which makes the failure partial and intermittent and sends everyone looking at load balancing.
The Kubernetes API will tell you the ConfigMap exists and when it was last modified. It will not tell you what changed inside it. Watching the mutation stream is the only way to have the old value and the new one, which is also the only way to produce a fix rather than an observation.
Policy denials that are exposed nowhere else
A Pod Security Admission denial is not a metric. It is an audit event, and if nothing is consuming the audit webhook it is simply not in your monitoring at all. The workload just never starts, and the reason is in a log nobody is reading.
Text-only failures from services with no metrics
A disk filling up announces itself as no space left on device in a container log. A service with no HTTP instrumentation announces its 5xx the same way. An internal certificate expiring is invisible to a blackbox probe pointed at the edge. All three are ordinary incidents and all three live only in log text.
A gap in coverage is not usually a threshold set wrong. It is a source nobody is reading.↑ Back to top
What happens between the signal and the fix
Eight stages and two feedback paths. The shape matters more than the names: detection is the start of the work rather than the end of it, and the last four stages are what make it safe to automate.
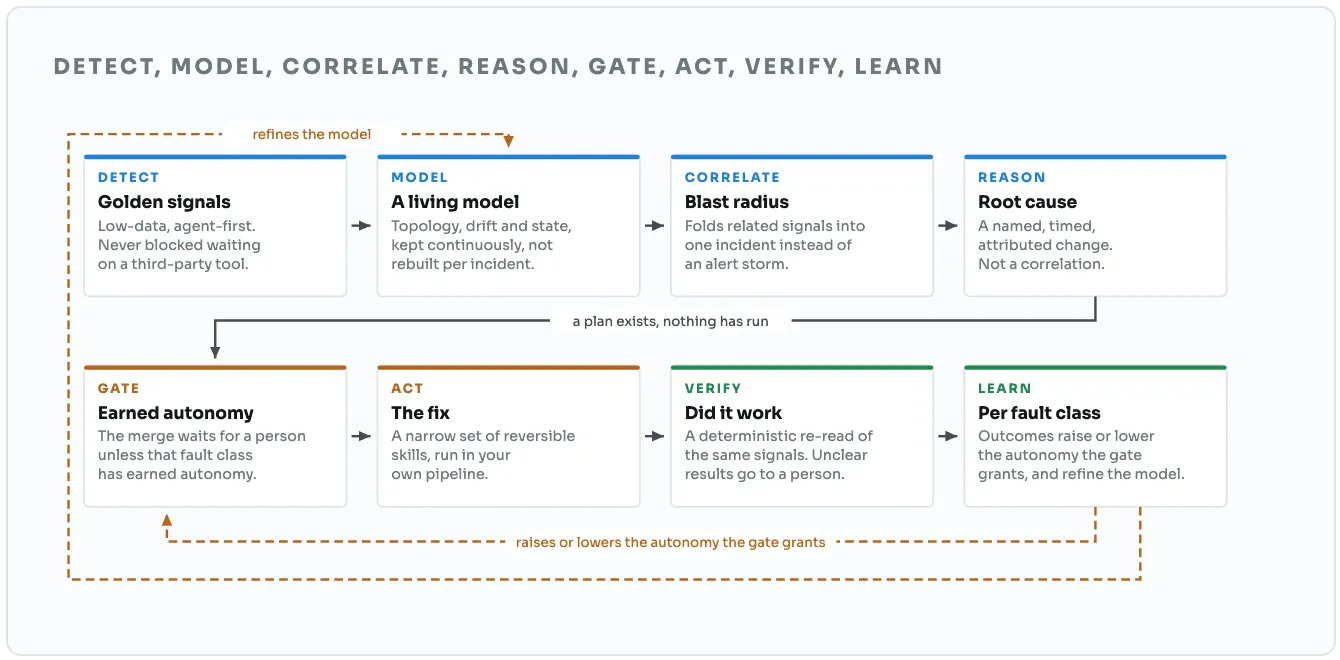
Most tools in this category implement the first four stages and stop. That is not a criticism, it is the honest state of the market, and the first four are the hard engineering. But a loop that ends at reasoning hands you a conclusion and leaves the work where it was.
The four stages that decide whether it is safe
Gate
The plan becomes a pull request in your repository. When confidence and the record for that specific fault class are both high enough, the merge does not wait for a person. Otherwise a person reviews the evidence and merges. The gate is per class, which is the whole safety model in one sentence.
Act
A narrow set of reversible skills with pre-flight checks, not a general-purpose shell. Each one runs in your own CI runner with the DataAgent CLI, under your credentials. The narrowness is the point: an agent that can do anything is an agent whose blast radius you cannot describe to your security team.
Verify
A deterministic check, not a model grading its own work. An ambiguous result goes to a person. The incident is not closed when the change is applied. It is closed when the signal that opened it returns to normal.
Learn
Per fault class. Outcomes build the record you use to decide a promotion. A class whose fixes stop working goes back to waiting for a person, without anyone filing a ticket.
And the incident is the record of all of it
When the change completes the incident is updated with what ran, where, and what the verify step found. The incident stays the system of record for every fault the estate has handled, whether a person merged the fix or the merge went ahead without waiting.
Questions this section answers
- What stops it acting on a bad diagnosis?
- Three things in series: confidence has to clear a bar, the fault class has to have earned autonomy through prior results, and the action has pre-flight checks that can refuse. Any one of them failing means the pull request waits for a person.
- How do I know the fix actually worked?
- The verify stage, and it is a deterministic check. If the signal does not return to normal the incident stays open and the outcome counts against that class.
Where the agent runs, and which way the connection goes
Otto, our agent, runs in the cluster with an outbound connection to the hub. Nothing is opened inward, and Otto has no permission to change anything, now or later.
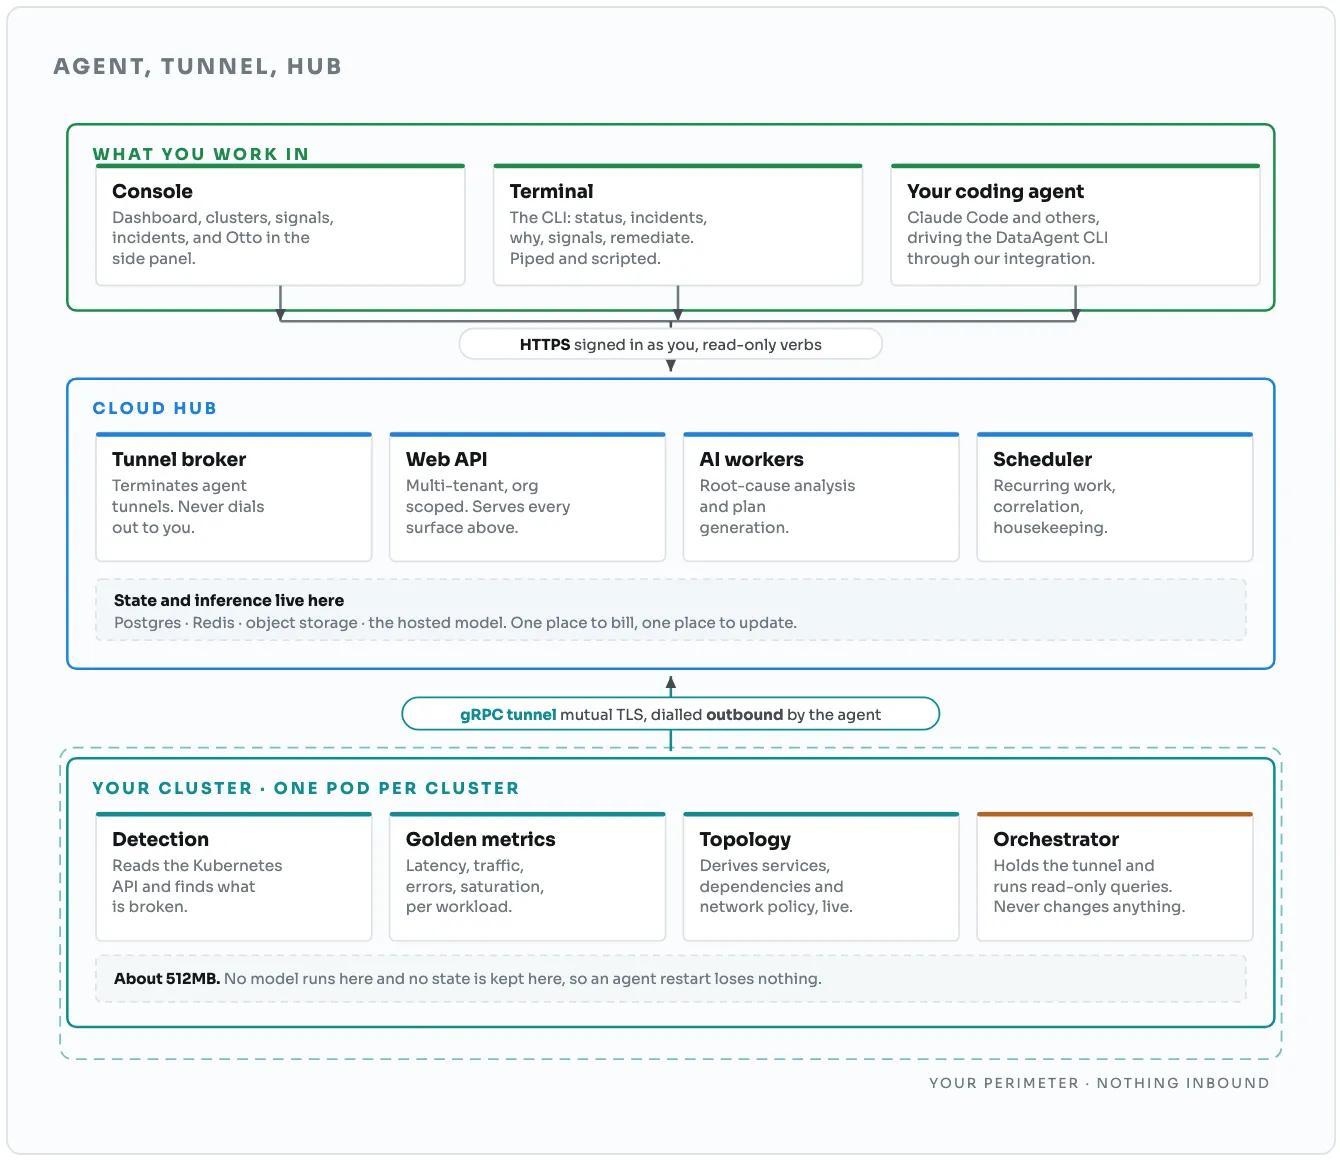
Otto runs in the cluster because that is where the sources are: a watch on events.v1 is not something you do from outside, and shipping every event out so it can be watched remotely is the expensive architecture this product exists to argue against.
What it needs, and what it does not
Otto, always
Read-only RBAC on the resources it watches, and an outbound connection. That is the whole install, and it does not change later. Write access never goes to DataAgent. Not on day one, not after a hundred successful runs.
The CLI, in your pipeline
Changes are applied by the DataAgent CLI, in your own CI runner, under your credentials. The write stays on your side of the line permanently.
Where the write actually happens
This is the part worth being exact about, because it is the question a security review opens with. The hub produces a plan and never applies it. The plan becomes a pull request in your repository, the merge is the approval, and your own CI runner executes it with the DataAgent CLI, under your credentials. Then the fix is verified and the incident record is updated.
What autonomy changes is not Otto's permissions. It is whether the merge for a given fault class waits for a person. Both paths run in the same place, under the same credentials, through the same pipeline.
What leaves the cluster
Raw telemetry stays where it was born; only findings leave. The expensive, sensitive bulk of your logs and metrics stays where it already is, which is also why DataAgent can read backends it does not own without creating a second copy of your observability bill.
What to check before you install anything
Ask any agent vendor, including this one, four questions. All four should be answerable in a sentence each, and together they describe the entire security posture.
- Which RBAC verbs does it request, and does that change later? If the answer grows over time, the day-one posture is not the posture.
- Which direction does the connection go? Outbound means nothing has to be opened inward.
- What leaves the environment? Findings, or your raw telemetry.
- Who holds the credential that performs the fix? This is the one most vendors answer vaguely, and it is the one that matters most.
Questions this section answers
- Does it need cluster-admin?
- It needs no write permission at all. Otto is read-only for its whole life. Every change runs from a pull request in your repository, in your own CI runner, under credentials you issue and can revoke without involving us.
- What if the cluster has no Prometheus?
- The alert bridge and the PromQL poller need one, and the other five sources do not. A bundled minimal collector set exists for clusters that have nothing, so the floor is not blocked on a prior install.
Autonomy, one fault class at a time
The unit of trust is a fault class, not the agent. That is the single design decision that makes the rest of this defensible to a security review, and it is the thing to ask every vendor in this category about.
Why one switch is not a safety model
- Stage 01
Recommend only: A plan to read
The class is recognised and a plan is written with its evidence. A person decides what to do with it.
- Stage 02
Approve first: A person merges
The plan arrives as a pull request. A person reviews it and merges it.
- Stage 03
Autonomous: The merge does not wait
It still runs in your repository, on your runner. The right is lost if the record turns.
Where the evidence comes from
A record of forty injections is only possible if there is something to inject. That is the part of this that is unusual, and it is worth being concrete about because it is the claim that most separates this from the rest of the category.
There is a published fault catalogue: 35 catalogued faults, 32 of them injectable into a live, resettable sandbox where the expected root cause and the expected remediation are both known in advance, because we injected the fault. Running the full loop against a known answer produces a score rather than an opinion.
Questions this section answers
- Who decides when a class is promoted?
- You do. The record is evidence for the decision, not a substitute for it, and the promotion is an explicit act with an audit trail.
- Can I keep a class on approve first forever?
- Yes, and for some classes that is the right answer permanently. Anything that deletes data or changes a security boundary is a reasonable candidate for never.
What it actually fixes on the Kubernetes plane
The catalogue is published, counted and versioned, so this is a count rather than a claim. Twenty-four of the thirty-five catalogued faults live on the Kubernetes plane; the other eleven are cloud, and section 9 is about why both planes are needed.
| Family | Examples from the catalogue |
|---|---|
| Workload lifecycle | ImagePullBackOff and ErrImagePull, init-container failures, liveness probe misconfiguration, a preStop hook that cannot run |
| Scheduling | Insufficient CPU with no node to take the pod, a node pool that cannot provision, a DaemonSet pod that will not schedule |
| Storage | An unbound PersistentVolumeClaim, a StatefulSet stuck on a missing StorageClass |
| Rollout | A PodDisruptionBudget that blocks every eviction, an autoscaler that cannot scale because quota is exhausted |
| Network | A NetworkPolicy blocking the database port, DNS resolution failing inside the pod, cache and broker egress dropped |
| Configuration and access | A ConfigMap value changed by hand, a missing RBAC verb, an expired certificate, a Service with no endpoints |
| Runtime | JVM heap exhaustion ending in OOMKilled, CPU throttling, a latency brownout with every pod still Ready |
Three of those are worth noticing because they are the ones that pass every health check: CPU throttling, the latency brownout, and the ConfigMap change. In all three the pods report Running and Ready, nothing crash-loops, and the service is still unusable.
↑ Back to topWhy a Kubernetes-only agent is not enough
A large share of what looks like a Kubernetes incident starts outside the cluster, in IAM, in a security group, or in a managed service. An agent that cannot see that plane will diagnose the symptom correctly and name the wrong cause.
Three incidents that look like Kubernetes and are not
- A pod cannot reach the database. Inside the cluster the NetworkPolicy is correct and the Service has endpoints. The 5432 ingress rule was revoked on the managed database security group, which is an API call in a different plane entirely.
- A service starts returning 503 hours after a change nobody connected to it. An IAM policy gained an explicit deny on a secret. The pods kept working off a cached credential until it expired, which is why the change and the incident look unrelated.
- Pods stay Pending and no node arrives. The scheduler says insufficient CPU, which is true. The node provisioner was refused permission to launch instances, and that refusal is only in the controller log and the cloud audit trail.
The symptom is in the cluster. The change is not. Nothing that only reads Kubernetes can close that gap.↑ Back to top
Right-sizing what the cluster emits
An agent that pulls only the evidence a fault needs does not need everything collected continuously. The design of the agent and the size of the bill turn out to be the same decision, which is why this section is in a product guide rather than a pricing one.
In a Kubernetes estate the dominant cost driver is cardinality, and the dominant source of cardinality is pod-level series. A rough but stable heuristic is nodes times fifteen hundred, plus pods times two hundred, plus whatever the applications emit, and on a medium estate that lands around 1.4 million active series. That figure is our own model, not third-party research.
Why most optimisation tools cannot reach it
The usual approach prunes after collection: look at what nobody queries, then aggregate it away. That is real and worth doing, and it has two structural limits. It acts after the data has arrived and the ingestion has been charged for, and it only sees one vendor's data, so an estate running more than one backend has a second bill it cannot touch.
Acting at the source is a different operation. Routine logs go to cheap storage without being ingested hot, the recent window stays where you read it, and when an incident needs detail DataAgent reads what that fault needs, in place. Nothing is deleted and nothing stops being queryable.
↑ Back to topThe first step is read-only and costs nothing
Whatever you decide about an agent, the useful first move is the same and commits you to nothing: a free, read-only assessment of which failure classes you are covered for, and what your observability bill could right-size down to.
- Stage 01
Describe the stack
No credentials, no connection. You get the list of failures that apply to an estate shaped like yours.
- Stage 02
Point it at a backend
Read-only queries against the observability stack you already run. Only an abstracted report leaves.
- Stage 03
Read the gaps
Which applicable classes have never fired, which have no rule watching for them, and what the bill could right-size down to.
- Stage 04
Inject one
Pick a fault that matters, break it on purpose in a non-production cluster, and watch what happens.
Step four is the one worth insisting on, with any vendor. A list of covered faults is a document. A fault injected on purpose, caught, fixed and verified in front of you is a measurement, and the difference between the two is the subject of this entire guide.
↑ Back to topSo is it worth it?
Worth it if your incidents are control-plane changes rather than capacity, and worth starting with the free, read-only assessment regardless.
The honest qualifier is the same one in Choosing an AI SRE for Kubernetes. If your problem is that something in the estate is dark, a broader observability platform is a better purchase than this and you should make it first. Depth on the Kubernetes and cloud control plane solves a different problem: you can already see the symptom and the time goes on working out what changed and then putting it right by hand.
Two checks on that, both cheap.
Split your last ten incidents into time spent noticing that something was wrong, and time spent working out what changed and fixing it. If the first number dominates, buy visibility. If the second does, this is the right half of the market.
Make the agent prove a class before you trust it with one. Not a demo of the product working, a demonstration of this failure being caught and fixed in an environment you control. That is what the injectable catalogue is for.
↑ Back to top